- NZD/USD keeps trailing 100-HMA, seven-day-old descending trend-line.
- An upside clearance can recall last week’s top, 0.6400 seem nearby key support.
NZD/USD remains below short-term important resistance-confluence as it trades near 0.6420 during early Tuesday.
A confluence including 100-hour moving average (HMA) and a seven-day-old downward sloping trend-line, at 0.6430/32, exert downside pressure while August 13 high surrounding 0.6472 can please buyers after the breakout.
In a case where prices rally past-0.6472, August 09 high of 0.6500 will be on the bulls’ radar.
Meanwhile, 0.6400 and the monthly low near to 0.6377 can entertain sellers during further declines whereas the year 2016 bottom close to 0.6348 may flash on bears’ list afterward.
NZD/USD hourly chart
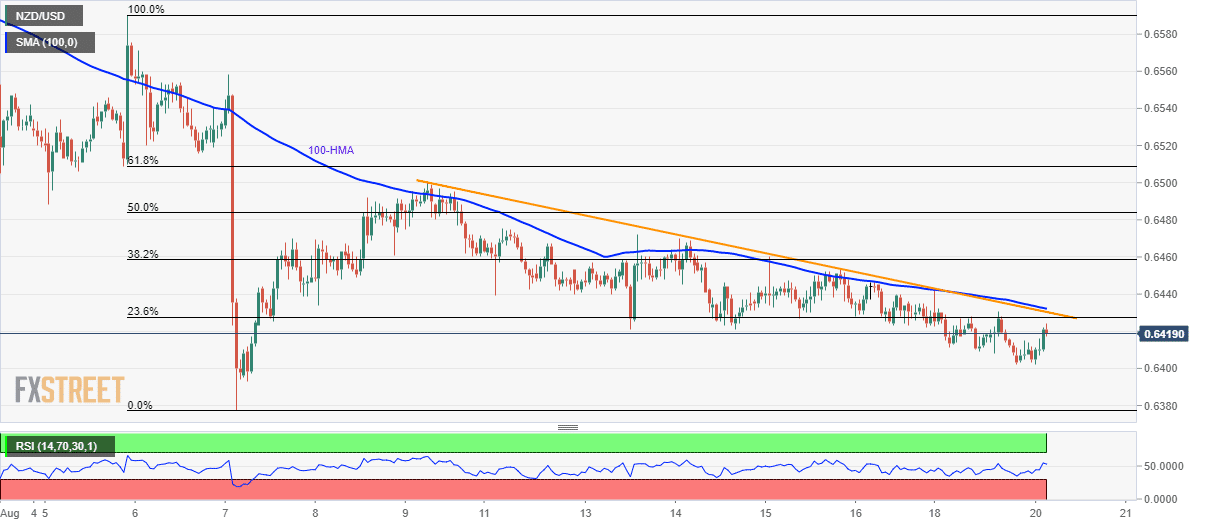
Trend: Bearish
