- Immediate horizontal-line, 61.8% Fibonacci retracement level and 1-week old descending trend-line challenge NZD/USD upside.
- May month low near 0.6480 becomes bears’ favorite.
Despite bouncing off 0.6534 after China’s better than forecast Caixin Manufacturing PMI data, NZD/USD is yet to clear immediate horizontal-resistance as it trades near 0.6558 during early Thursday.
The July 10 low and previous candle high forms nearby horizontal-line that limits the pair’s immediate upside around 0.6567/68, a break of which can extend the recovery towards 61.8% Fibonacci retracement of May-July upside around 0.6600 and then to a weeklong descending trend-line, at 0.6613.
If at all prices manage to cross 0.6613, 50% Fibonacci retracement near 0.6637 and 0.6655/56 should on buyers’ radar.
Alternatively, 0.6530 and 0.6500 can offer immediate supports to the pair ahead of highlighting May low near 0.6480 and the October 2018 bottom surrounding 0.6425.
NZD/USD 4-hour chart
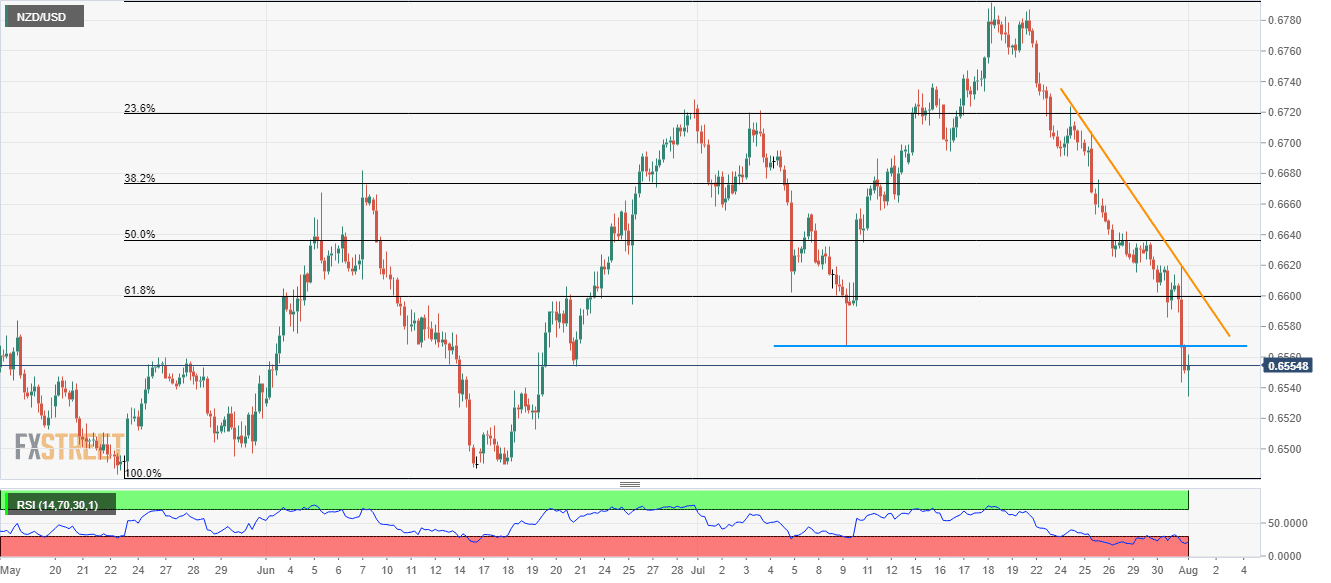
Trend: Bearish
