NZD/USD flashes fresh low of the month by being near 0.6620 after Australia’s sluggish inflation data also negatively affected the New Zealand Dollar (NZD) because of their trade ties.
The pair has already dipped beneath 61.8% Fibonacci retracement of its October to December 2018 upside, signaling brighter chances of further declines towards late-October highs near 0.6610 followed by January month low around 0.6585.
If at all the quote continues trading southward under 0.6585, 0.6570, 0.6510 and 0.6470 may offer intermediate halts during the further downpour to 0.6420.
Alternatively, an upside clearance above 61.8% Fibonacci retracement level of 0.6630 can recall 0.6670 and 50% Fibonacci retracement near 0.6700.
However, 0.6700-0.6710 area and 0.6730 resistance-confluence comprising 200-day SMA and a month old descending trend-line could challenge buyers then after.
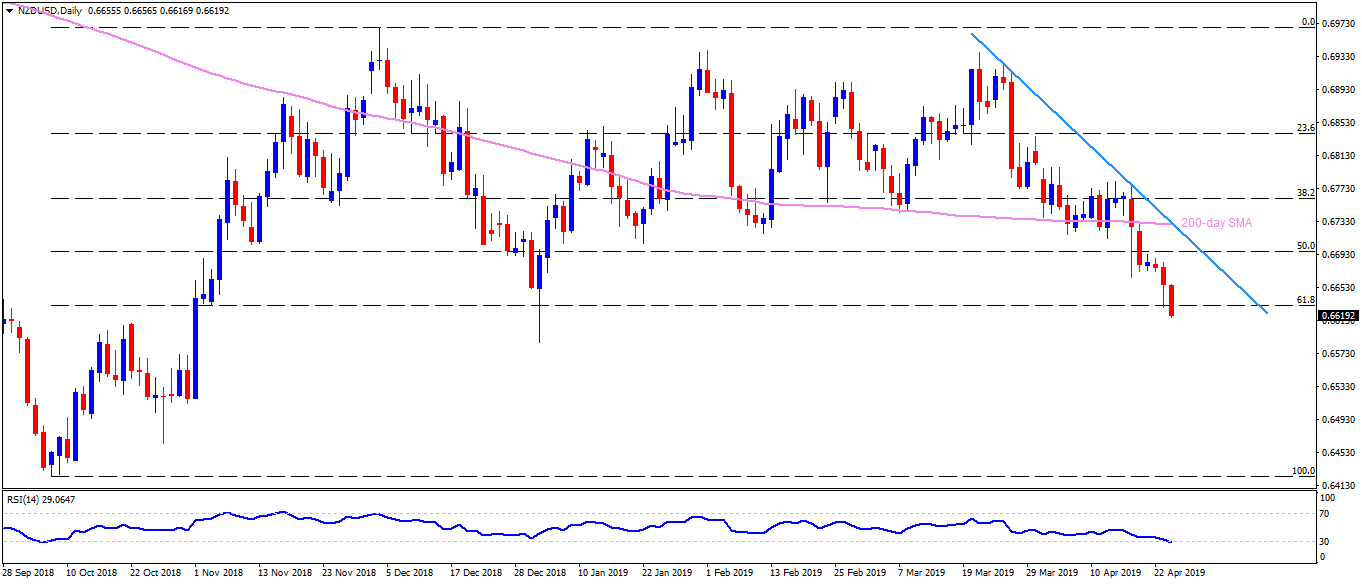
NZD/USD daily chart
Trend: Bearish
