- Upbeat New Zealand trade data broke immediate trend-line resistance.
- 0.6700 resistance-line still stands tall to challenge buyers.
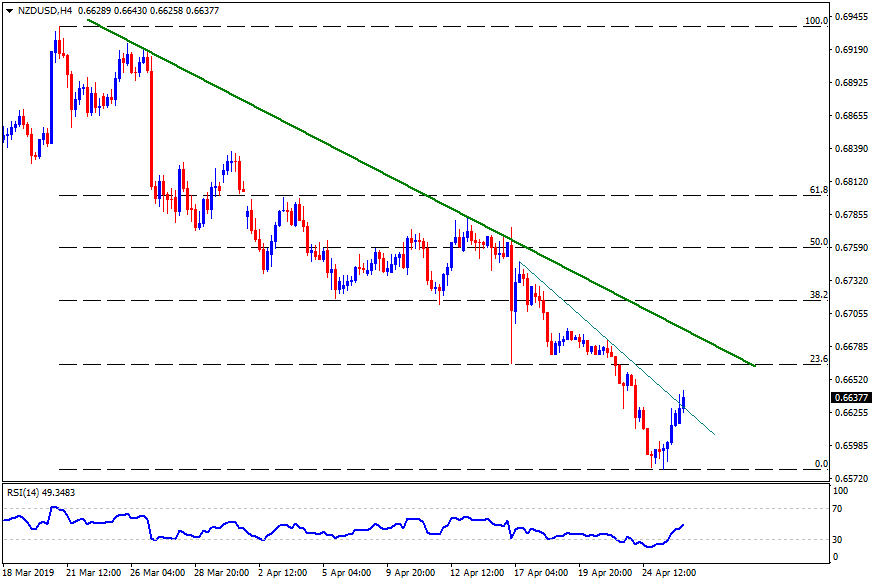
NZD/USD broke a week-long descending trend-line after New Zealand trade balance data flashed better than forecast figures on early Friday and triggered the pair’s recovery towards current 0.6640 level.
Should the pair manage to hold the latest pullback, 0.6670 can offer an intermediate halt during its rise to a downward sloping trend-line at 0.6700 that’s likely a tough nut to crack.
In a case prices rally past-0.6700, 0.6715 and 0.6780 could please buyers.
Alternatively, the pair’s failure to hold the strength can recall 0.6600 and 0.6580 back on the chart.
Also, bears’ dominance below 0.6580 may shift market attention to October 2018 lows near 0.6510.
NZD/USD 4-Hour chart
Trend: Bearish
