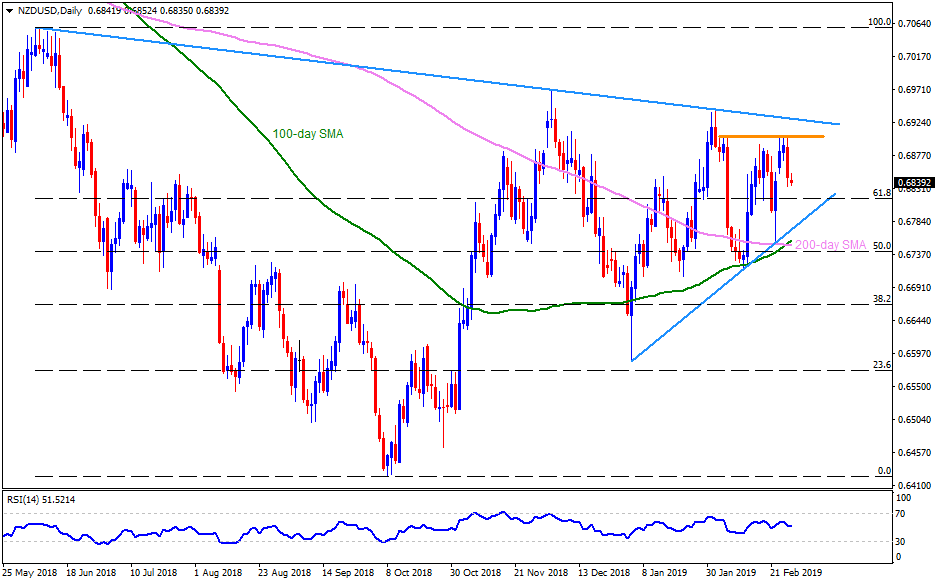
NZD/USD daily chart
- NZD/USD trades near 0.6840 during early Asian sessions on Thursday.
- On Wednesday, the pair dropped from 0.6900-10 horizontal-resistance comprising highs marked since February 04.
- On a daily chart, 0.6805 acts as immediate support for the pair before dragging it to an eight week long upward sloping trend-line at 0.6770.
- In case prices slide under 0.6770, the pair may take a halt around 0.6755-50 region including 100-day and 200-day simple moving averages (SMAs).
- If at all the quote continue trading southward under 0.6750, chances of its plunge to 2019 low around 0.6705 can’t be denied.
- Meanwhile, 0.6870 can act as immediate resistance for the pair before visiting 0.6900-10 area.
- Though, pair’s rise beyond 0.6910 isn’t a sure signal for its rally as a descending trend-line stretched since June 2018 can challenge the Bulls near 0.6935.
- During the pair’s advances above 0.6935, 0.6970 and 0.7000 may become buyers’ favorites.
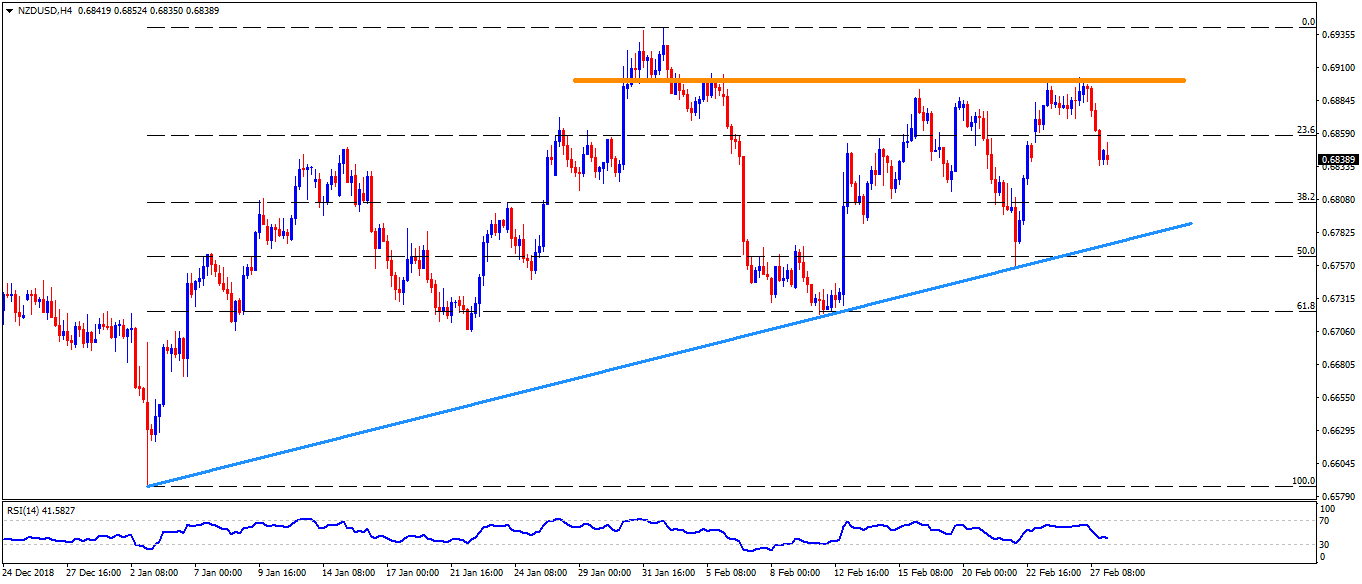
NZD/USD 4-Hour chart
- On H4, 0.6720 may offer intermediate halt after 0.6750 and before 0.6705 whereas 0.6670 and 0.6620 can please sellers beneath 0.6705.
- On the upside, 0.6885 can act as a buffer during the pair’s rise towards 0.6900-0.6910
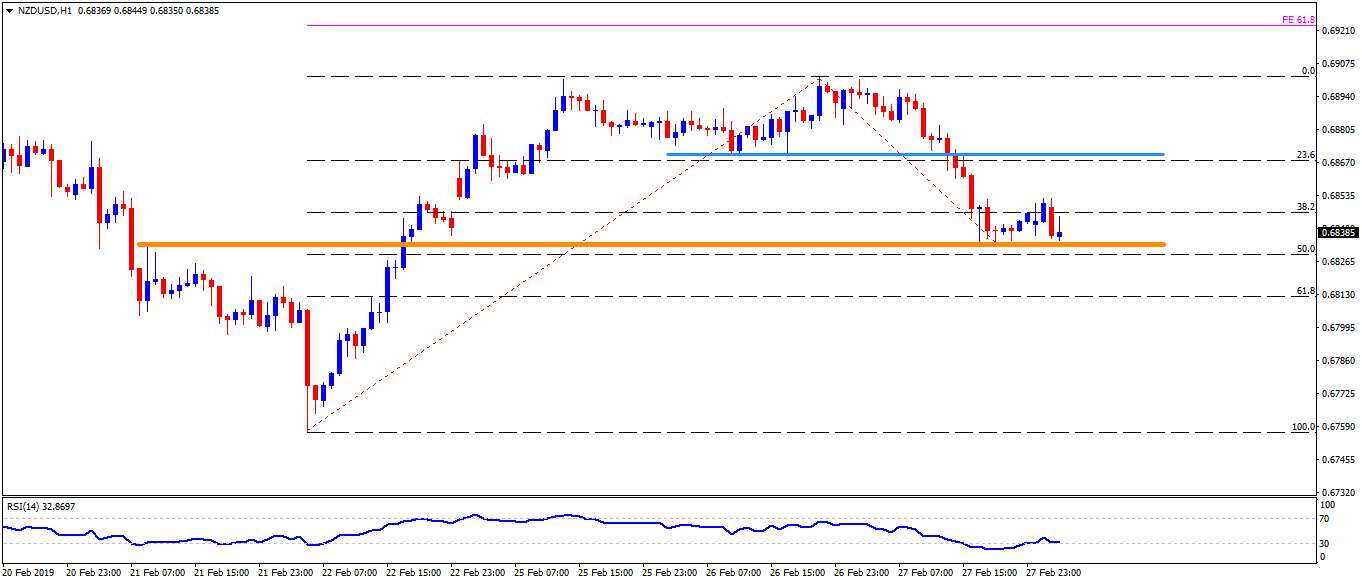
NZD/USD hourly chart
- 0.6815 and 0.6790 can come forward as supports on the break of 0.6735-30 horizontal-region.
- An upside clearance of 0.6910 can have 61.8% Fibonacci retracement of last one week move, at 0.6925, as a follow-on benchmark to watch.