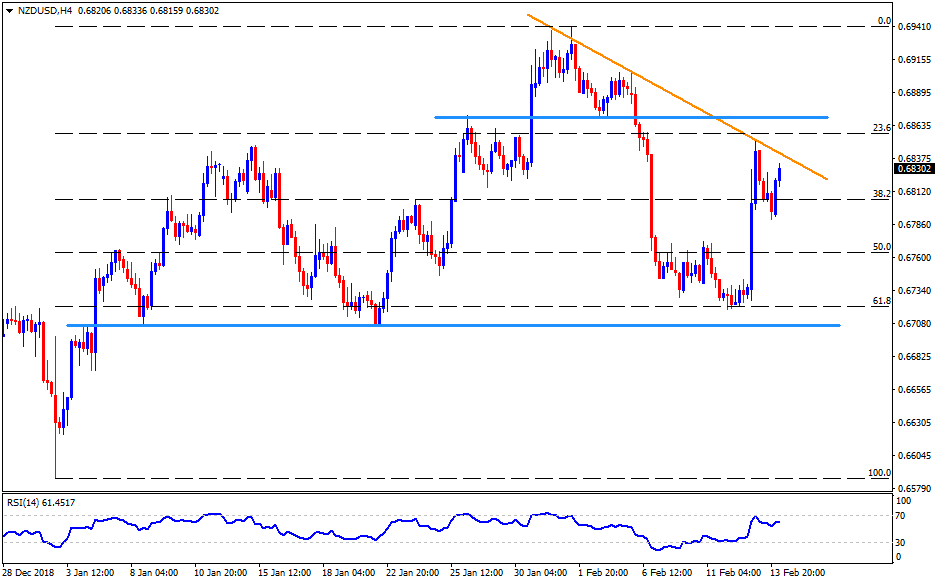
- The NZD/USD pair again heads to two-week-old trend-line resistance, at 0.6845 now, during early Thursday.
- Should the pair manage to cross 0.6845, the horizontal line connecting late-January highs to early February lows, at 0.6870, may gain buyers’ attention.
- During the additional upside past-0.6870, 0.6900 and the month’s high near 0.6945 can be targeted if holding long positions.
- In case prices fail to hold recent recovery, 0.6785 and 0.6770 can provide nearby supports ahead of highlighting the 61.8% Fibonacci Retracement level of 0.6720 and the 0.6705 horizontal support.
- If bears continue dominating price sentiments past-0.6705, 0.6670 and 0.6650 might offer intermediate halts during the plunge to 0.6620 and then to 0.6585.
NZD/USD 4-Hour chart
Additional important levels:
Overview:
Today Last Price: 0.6832
Today Daily change: 37 pips
Today Daily change %: 0.54%
Today Daily Open: 0.6795
Trends:
Daily SMA20: 0.6806
Daily SMA50: 0.679
Daily SMA100: 0.6727
Daily SMA200: 0.6754
Levels:
Previous Daily High: 0.6853
Previous Daily Low: 0.6727
Previous Weekly High: 0.6907
Previous Weekly Low: 0.6729
Previous Monthly High: 0.694
Previous Monthly Low: 0.6516
Daily Fibonacci 38.2%: 0.6805
Daily Fibonacci 61.8%: 0.6775
Daily Pivot Point S1: 0.673
Daily Pivot Point S2: 0.6665
Daily Pivot Point S3: 0.6604
Daily Pivot Point R1: 0.6856
Daily Pivot Point R2: 0.6918
Daily Pivot Point R3: 0.6982
