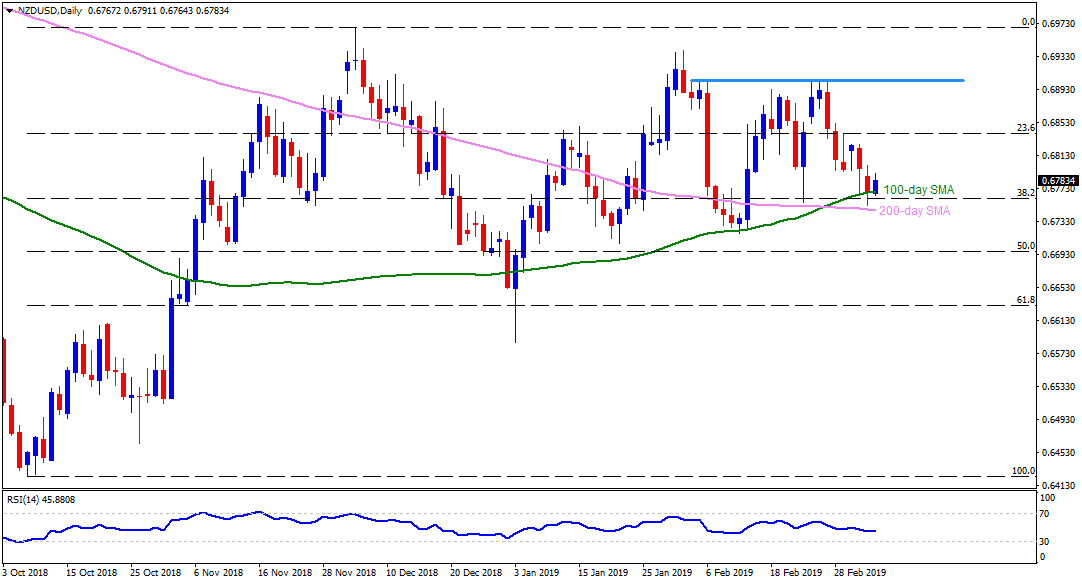
NZD/USD daily chart
- NZD/USD is taking the bids around 0.6785 during the early session on Thursday.
- Pair’s pullback from 100-day simple moving average (SMA) seems presently helping buyers to aim for 0.6800 marks. Though, 23.6% Fibonacci retracement level of October – December upside, at 0.6845 may limit further advances.
- If at all the buyers manage to conquer 0.6845, 0.6870 and 0.6890 could become their forthcoming targets ahead of confronting 0.6900/10 resistance area comprising highs since February 04.
- Alternatively, weakness under 100-day SMA level of 0.6765 highlights 0.6745 including 200-day SMA.
- During the additional declines beneath 0.6745, 0.6690 and 0.6650 could flash on bears’ radar.
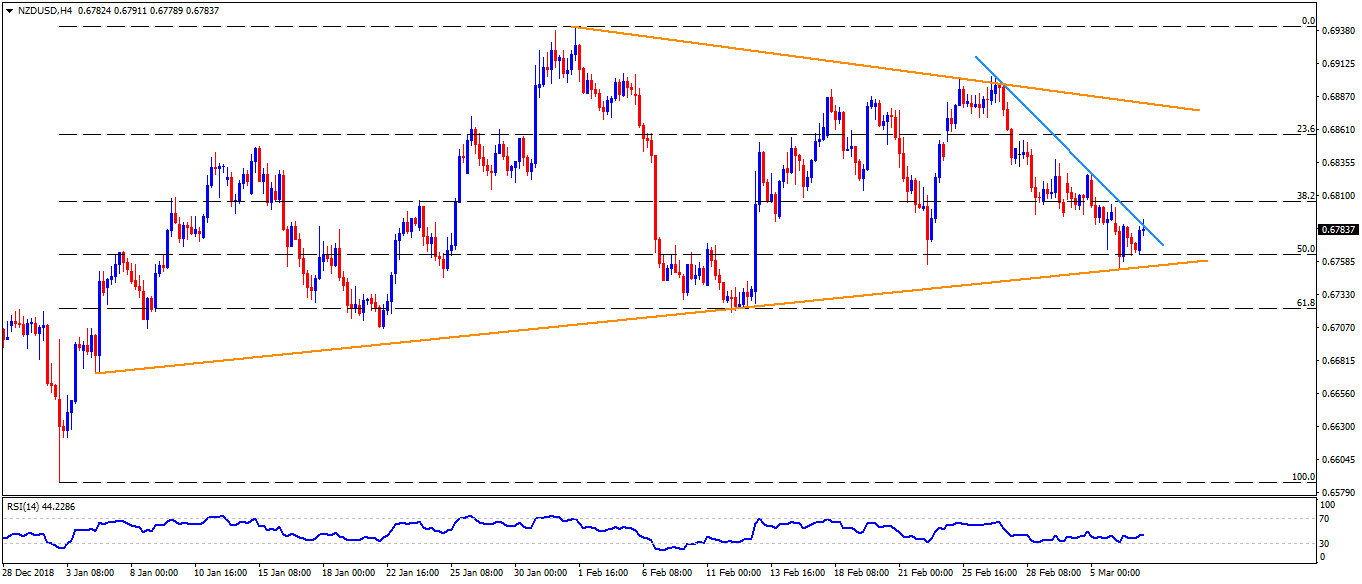
NZD/USD 4-Hour chart
- The pair struggles with an adjacent resistance-line to justify its strength on H4.
- 0.6830 may offer an intermediate halt during the rise to 0.6845 if the pair manages to cross 0.6800.
- Also, 0.6720 is an extra support-point to watch after 0.6745.
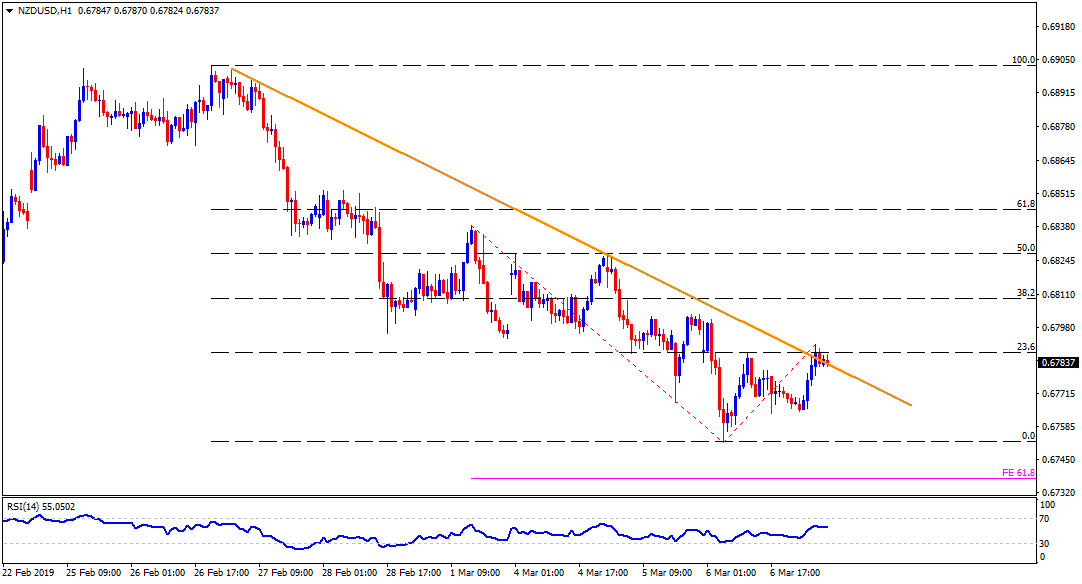
NZD/USD hourly chart
- 61.8% Fibonacci expansion of its latest pullback moves, at 0.6735, could magnify the distance between 0.6720 and 0.6745.