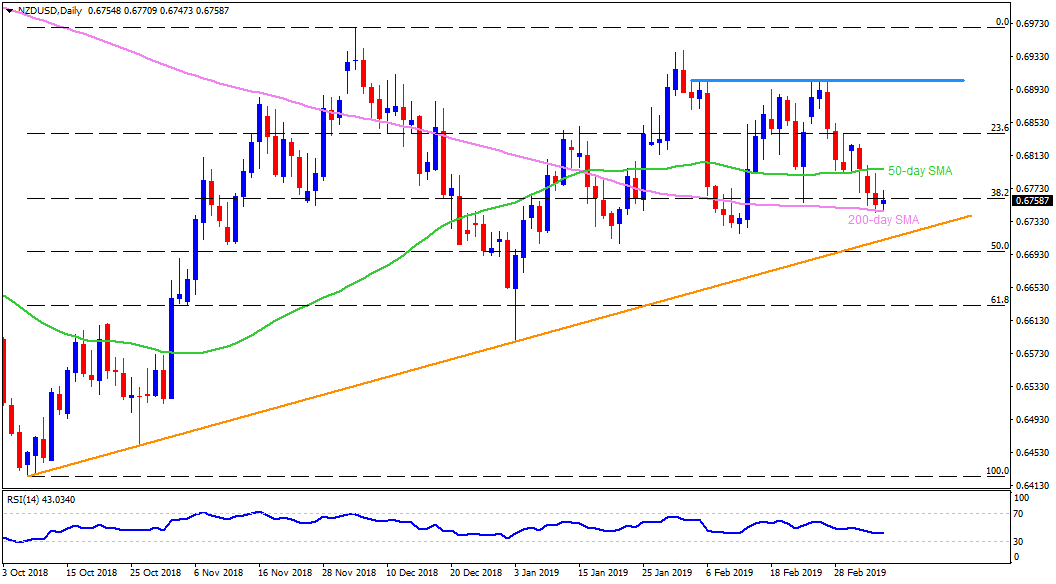
NZD/USD daily chart
- The New Zealand Dollar (NZD) is taking bids around 0.6760 against the USD on early Friday.
- The NZD/USD pair dropped to a three-week low on Thursday but couldn’t slip beneath 200-day simple moving average (SMA), at 0.6745 now.
- The quote carried its pullback overnight and is presently bouncing off towards 50-day SMA level of 0.6795, a break of which can escalate the recovery to 23.6% Fibonacci retracement level of October – December upside, at 0.6840.
- Though, multiple resistance area of 0.6900/10 could limit the pair’s advances past-0.6840.
- Alternatively, a daily close under 0.6745 can fetch prices to an upward sloping support-line stretched since October 2018 around 0.6710.
- During the pair’s decline below 0.6710, 0.6700 and 0.6650 can please sellers.
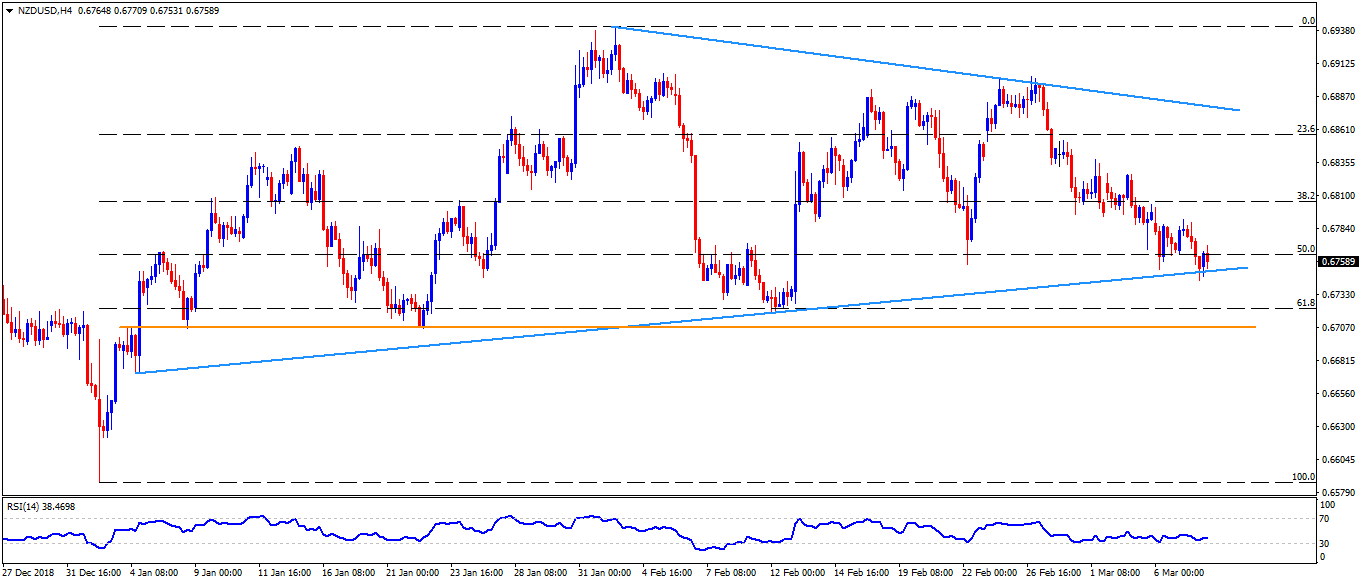
NZD/USD 4-Hour chart
- In addition to 200-day SMA, an ascending support-line joining the lows since January 04 also highlights the importance of 0.6745 rest-point.
- It should be noted that horizontal-line at 0.6705 could offer an intermediate halt between 06700 and 0.6710.
- Also, a descending trend-line connecting February highs, at 0.6880, could challenge the buyers after 0.6840.
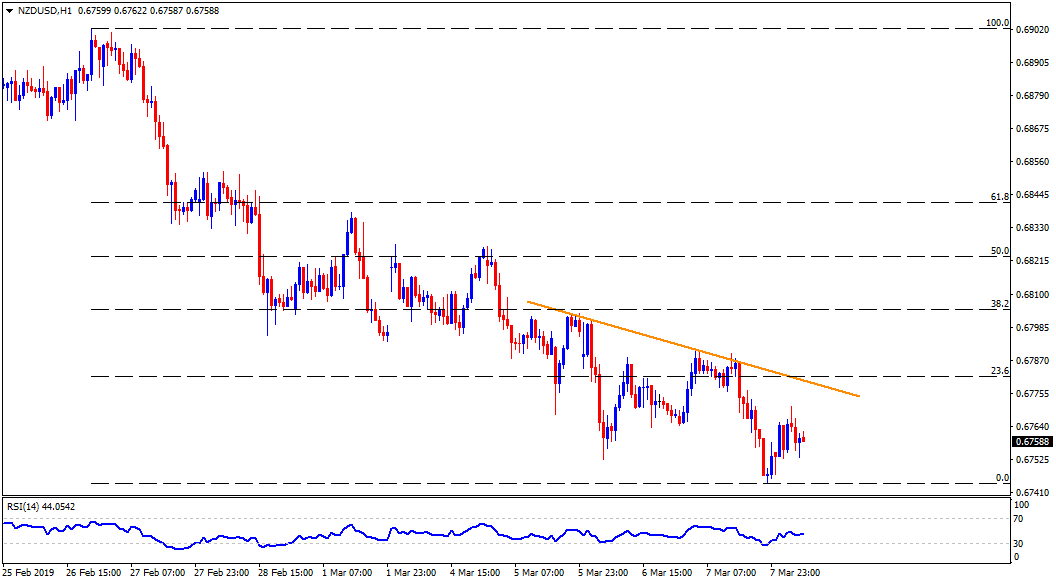
NZD/USD hourly chart
- Immediate descending resistance-line, at 0.6780, acts as an adjacent upside cap to the NZD/USD pair.