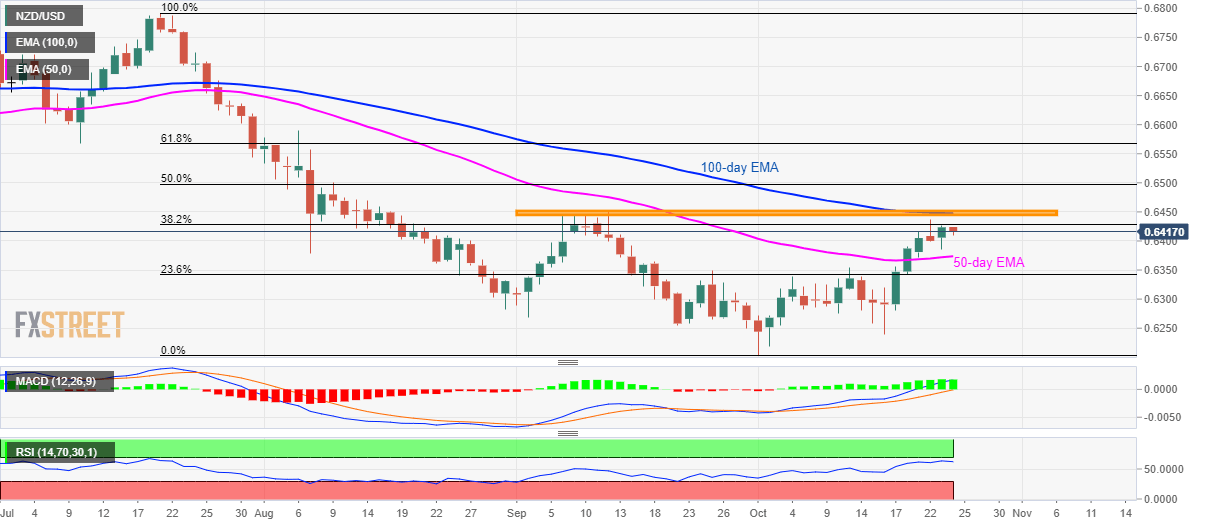
- NZD/USD again pulls back from 38.2% Fibonacci retracement.
- 100-day EMA, September month high becomes the key confluence to watch during further upside.
- 50-day EMA acts as nearby support.
Having registered another failure to cross 38.2% Fibonacci retracement of July-October declines, the NZD/USD pair declines to 0.6417 during early Thursday.
The pair now indicates a re-test of a 50-day Exponential Moving Average (EMA) level of 0.6374, a break of which can strength bears to target 23.6% Fibonacci retracement level around 0.6340 and 0.6300 round-figure.
Alternatively, pair’s sustained break above 38.2% Fibonacci retracement, at 0.6431, will accelerate the run-up to 0.6448/52 resistance-confluence including 100-day EMA and September month high.
That said, the buyers could target 50% and 61.8% Fibonacci retracement levels, near 0.6500 and 0.6570 respectively, during the pair’s further upside beyond 0.6452.
It should also be noted that momentum indicators like 14-bar Relative Strength Index (RSI) and 12-bar Moving Average Convergence and Divergence (MACD) are in support of further upside.
NZD/USD daily chart
Trend: pullback expected
