“¢ Struggles to build on Friday’s goodish rebound despite the ongoing USD retracement and remains sensitive to the US-China trade rhetoric.
“¢ With short-term technical indicators already in bearish territory, weakness below 50-hour SMA points to a resumption of the prior depreciating slide.
“¢ A decisive break below an important horizontal support would reinforce the bearish bias and turn the pair vulnerable to accelerate the downfall.
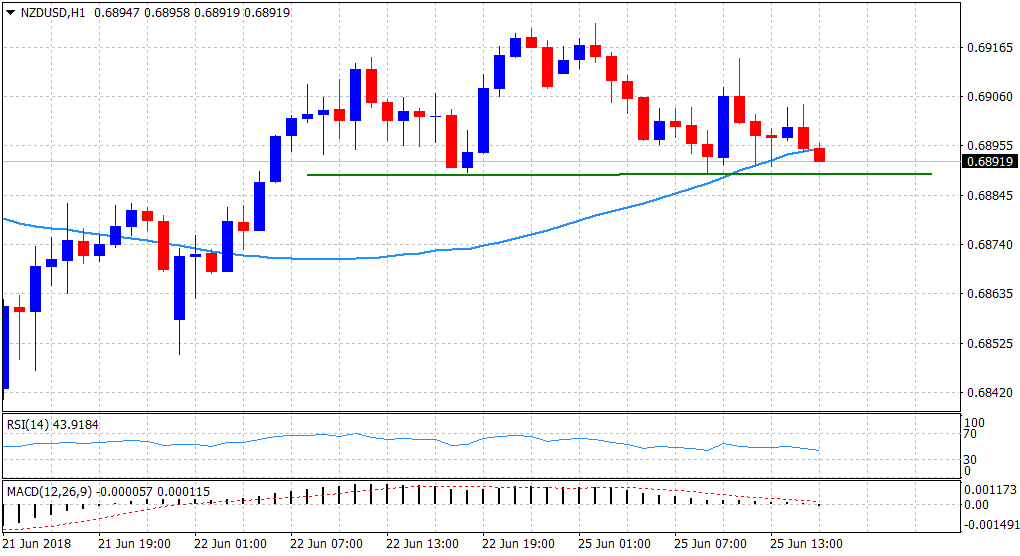
Current Price: 0.6892
Daily High: 0.6922
Trend: Turning bearish
Resistance
R1: 0.6922 (current day swing high)
R2: 0.6963 (R2 daily pivot-point)
R3: 0.7017 (50-day SMA)
Support
S1: 0.6869 (S1 daily pivot-point)
S2: 0.6826 (last Thursday’s swing low)
S3: 0.6780 (2017 yearly lows set in Nov.)
