- NZD/USD bounces off the four-year lows amid nearly oversold RSI conditions.
- Three-week-old falling trend-line acts as an immediate upside barrier.
With the oversold conditions of 14-bar relative strength index (RSI) activating the NZD/USD pair’s pullback from multi-year lows, the quote takes the bids to 0.6252 during initial trading session on Wednesday.
The pair now seems to head towards September 25 low near 0.6265 while a falling trend-line since September 12, at 0.6295, could restrict further upside.
In a case where prices rally beyond 0.6295, a confluence of 21-day simple moving average (SMA), a downward sloping trend-line since July 19, around 0.6330/35 could question buyers, which if broken confirms the falling wedge bullish formation that holds the gate for an upswing towards 0.6450 and 0.6500 resistance while eventually pushing optimists towards 0.6800 region.
On the contrary, pair’s declines below a recent low of 0.6203 might take rest on a falling trend-line since mid-June, at 0.6185 prior to revisiting 2015 lows around 0.6085.
NZD/USD daily chart
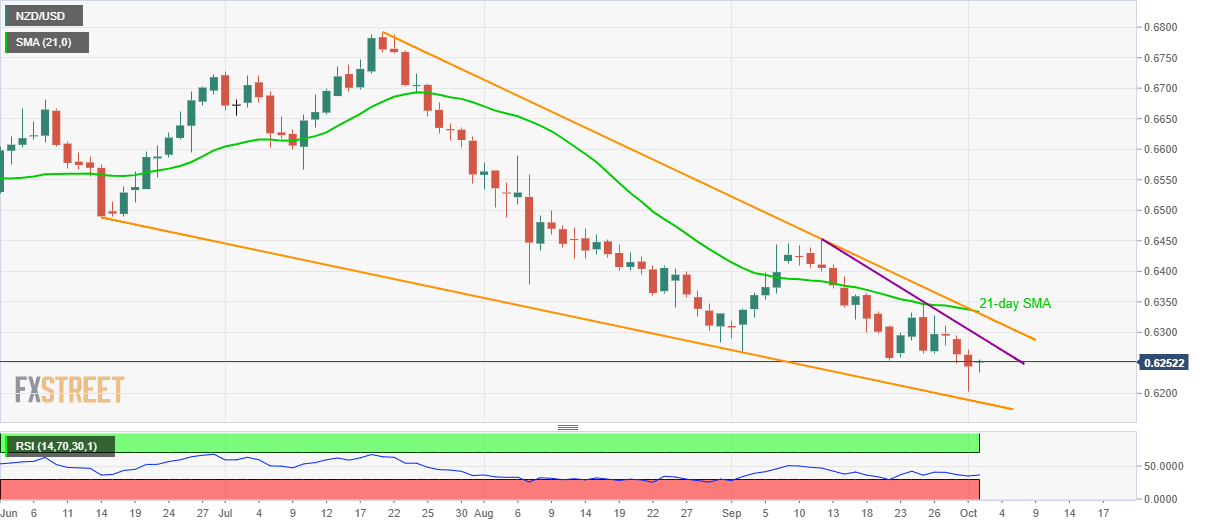
Trend: bearish
