- NZD/USD trades near 0.6870 during the initial Asian sessions on Thursday.
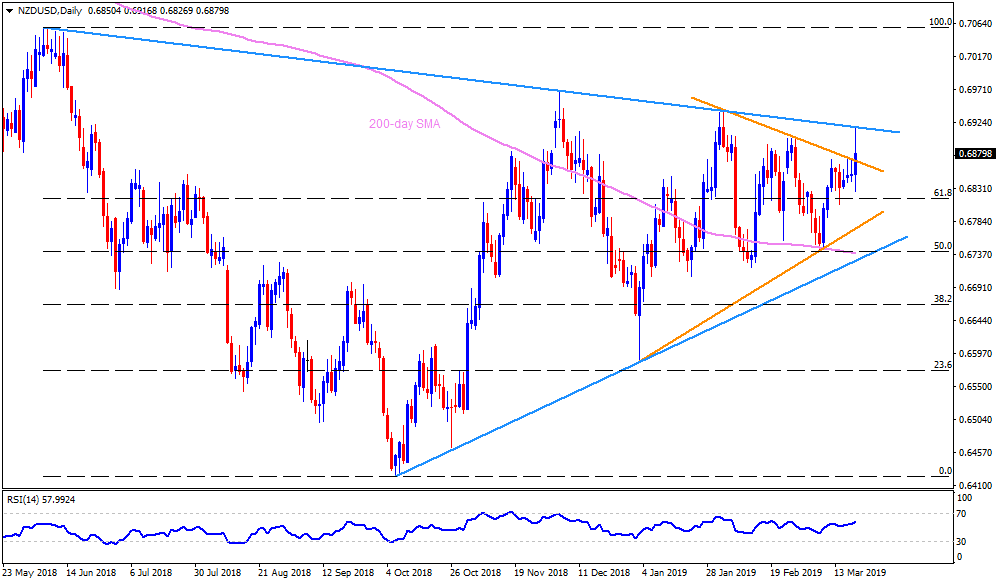
- The quote recently surged past seven-week-old descending resistance-line, at 0.6870, but is still behind the nine-month-old downward sloping trend-line stretched since June 2018, at 0.6920, ahead of the New Zealand Q4 2018 GDP.
- Forecasts suggest 0.6% QoQ growth over 0.3% prior with 2.5% YoY increase versus 2.6% earlier.
- Should Kiwi economy manage to please bulls with better growth numbers helping pair to cross 0.6920 barrier, 0.6970 becomes a small halt during the price rally to 0.7000 round-figure.
- In a case prices rally beyond 0.7000, chances of June highs near 0.7060 to come back on the chart can’t be denied. Though, 0.7020/25 can act as a buffer during the rise.
- On the downside, 0.6870 and 0.6825 are likely immediate supports for the pair ahead of highlighting 61.8% Fibonacci retracement level of June – October decline at 0.6815.
- During the pair’s additional weakness under 0.6815, 0.6800 and an ascending supportline joining January – March lows at 0.6770 can please sellers.
- Moreover, bears’ dominance under 0.6770 might be challenged by 0.6740/35 support confluence including 200-day simple moving average (SMA) and 50% Fibo, if not then 0.6730 support-line can gain market attention.
NZD/USD daily chart