“¢ The pair stalled its positive momentum just ahead of monthly tops and traded with a mild negative bias through the early European session.
“¢ Overbought conditions, as depicted by RSI (14) on the 1-hourly chart, seemed to be the only factor prompting some profit-taking.
“¢ However, given that the pair on Wednesday broke through over two-week-old descending trend-line resistance, dip-buying might now help limit any deeper corrective slide.
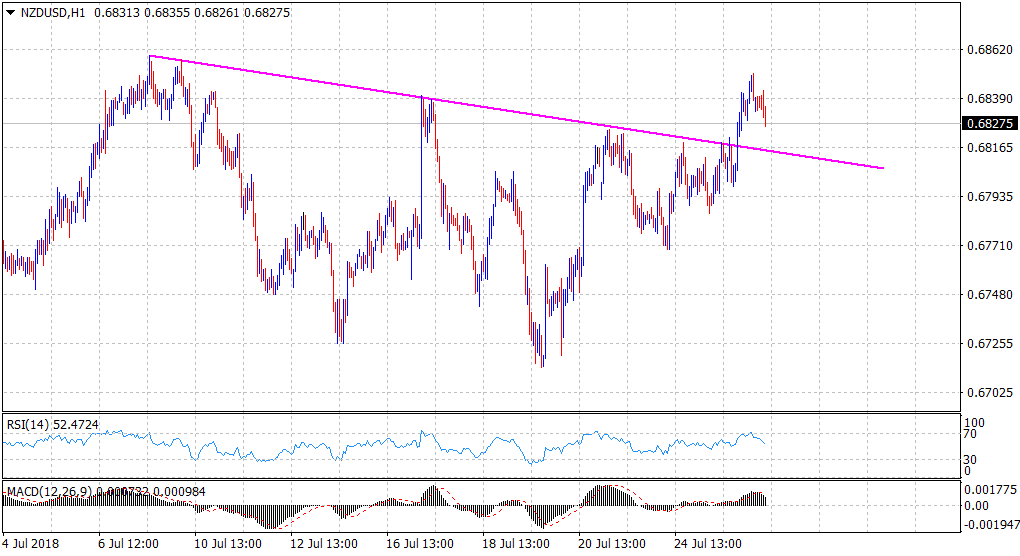
Spot rate: 0.6828
Daily High: 0.6851
Trend: Bullish
Resistance
R1: 0.6859 (monthly tops set on July 9)
R2: 0.6882 (50-day SMA)
R3: 0.6917 (R3 daily pivot-point)
Support
S1: 0.6802 (100-period SMA H1)
S2: 0.6769 (weekly low set on Tuesday)
S3: 0.6743 (S3 daily pivot-point)
