- Overbought RSI, repeated failures to cross key resistance highlights 100-day EMA support.
- 61.8% Fibonacci retracement and April month high lure buyers.
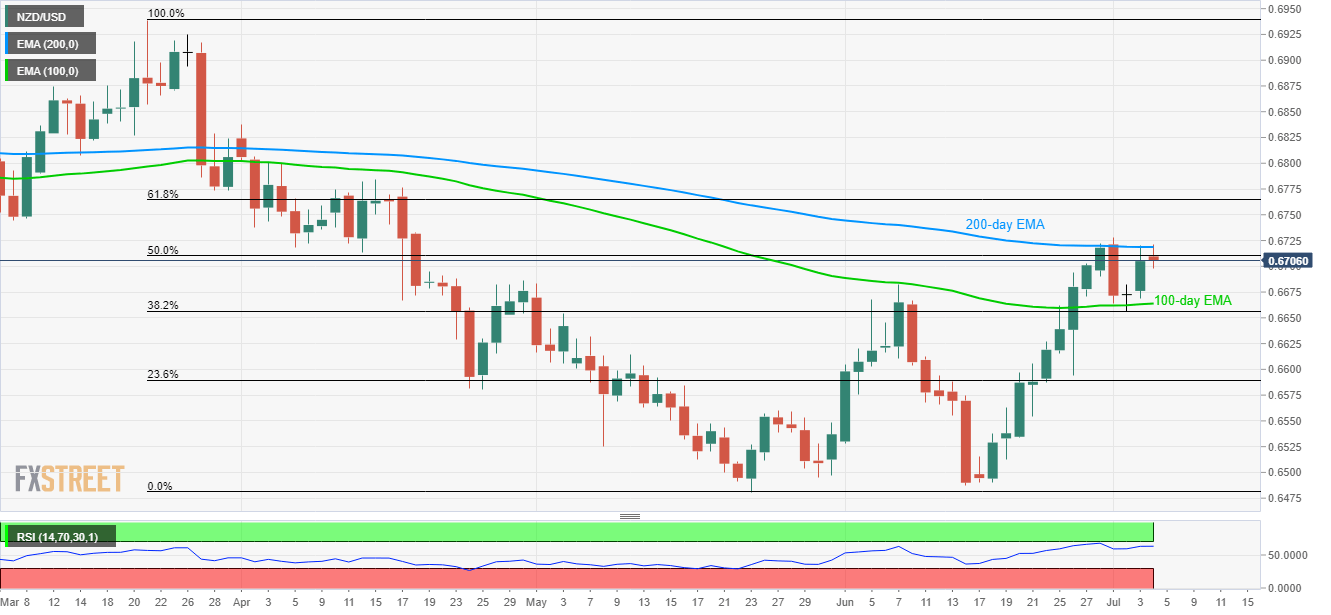
Having reversed from 38.2% Fibonacci retracement of its March-May decline, the NZD/USD pair again challenges the 200-day exponential moving average (EMA) while trading near 0.6707 during early Thursday.
Not only repeated failure to cross the key moving average resistance, at 0.6719 now, but overbought levels of 14-day relative strength index (RSI) also increases the odds for the pair’s pullback.
In doing so, 0.6682 can offer immediate support to the pair ahead of highlighting 100-day EMA level of 0.6664 and 38.2% Fibonacci retracement mark around 0.6656.
During the pair’s decline below 0.6656, 0.6610 and 23.6% Fibonacci retracement close to 0.6590 can become bears’ favorites.
Alternatively, pair’s rise past-0.6719 helps buyers to aim for 61.8% Fibonacci retracement level of 0.6765 whereas 0.6800 round-figure and April month top of 0.6838 may challenge further upside.
NZD/USD daily chart
Trend: Pullback expected
