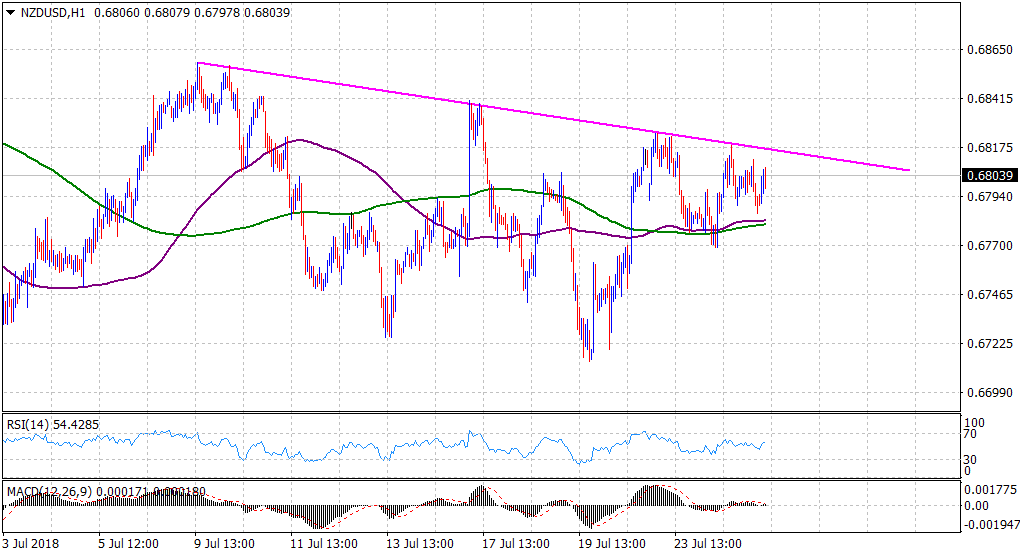
“¢ The pair’s overnight bullish momentum stalled near an important resistance, marked by over two-week old descending trend-line held since the early part of this month.
“¢ Technical indicators on the 1-hourly chart have struggled to gain any meaningful positive momentum and hence, it would be prudent to wait for a convincing breakthrough the mentioned barrier before positioning for additional gains.
“¢ Sustained weakness below 100/200-hour SMA confluence region would negate prospects for any further up-move and pave the way for a fall back towards the 0.6700 neighborhood.
Spot rate: 0.6804
Daily Low: 0.6786
Daily High: 0.6812
Trend: Bullish only above trend-line resistance
Resistance
R1: 0.6818 (descending trend-line hurdle)
R2: 0.6859 (monthly high set on July 9)
R3: 0.6900 (round figure mark)
Support
S1: 0.6780 (200-period SMA H1)
S2: 0.6747 (S2 daily pivot-point)
S3: 0.6720 (last Friday’s swing low)
