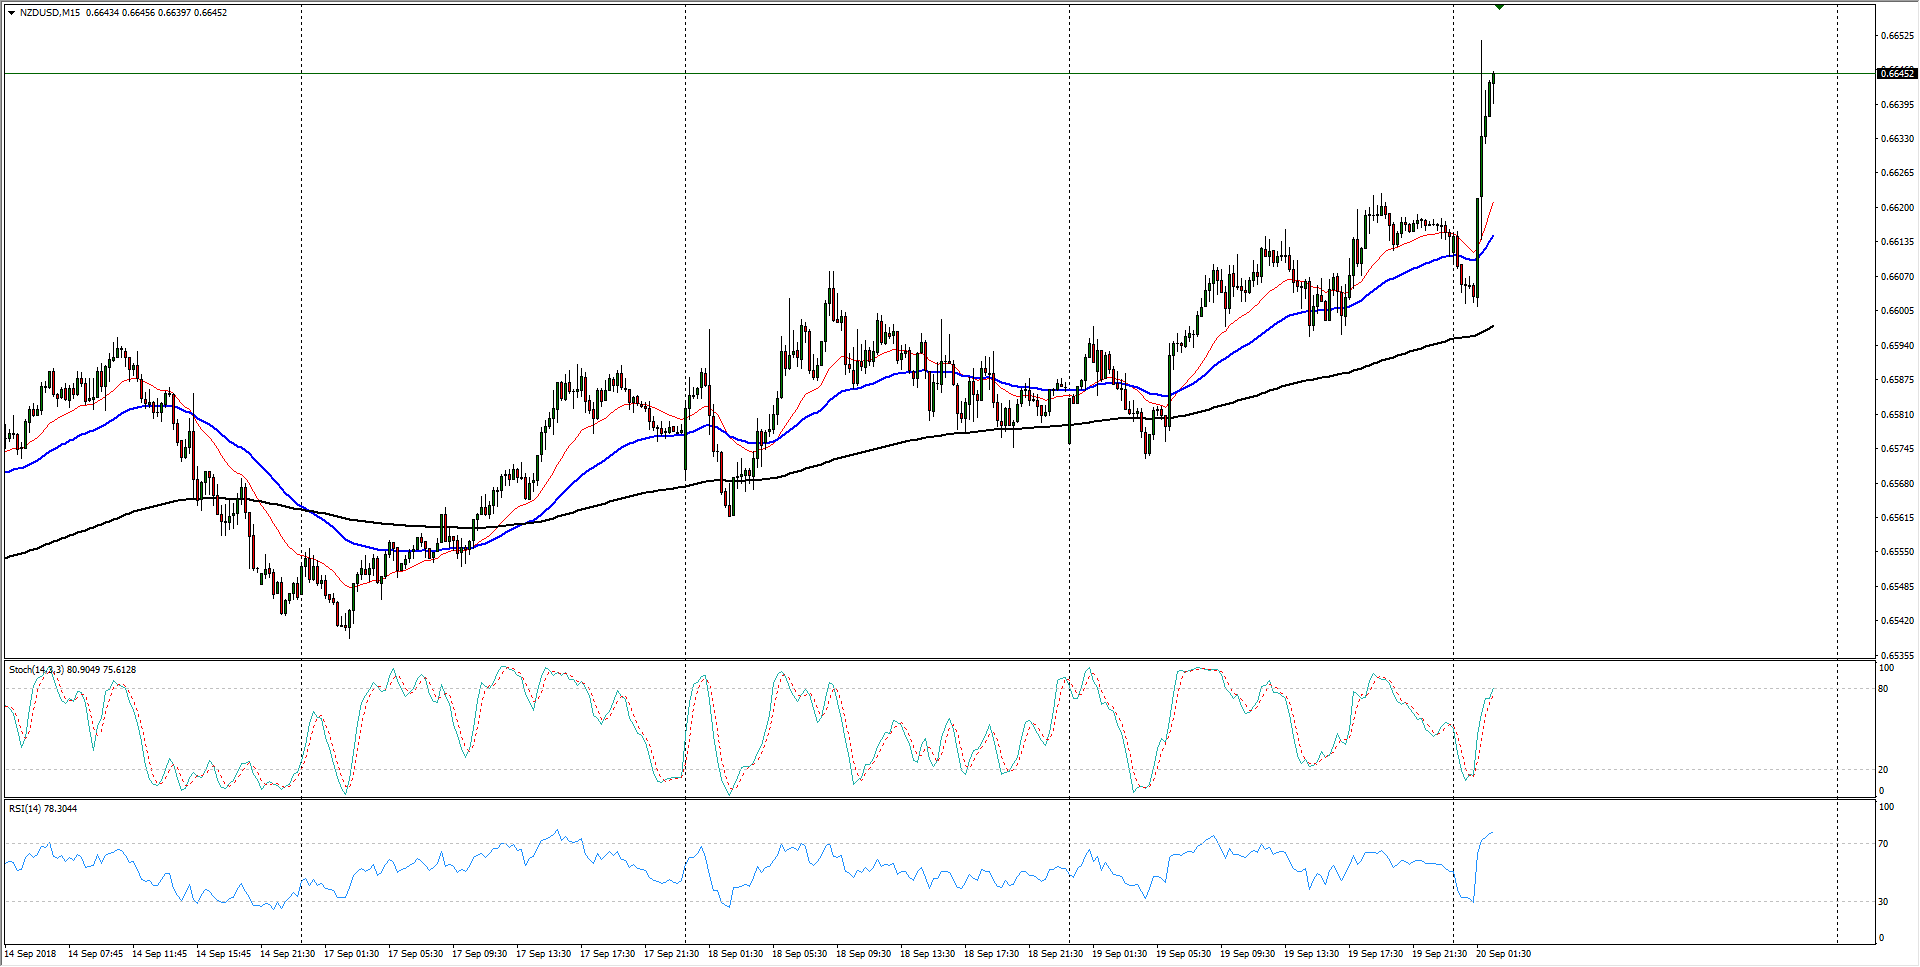
- A bumper reading for New Zealand’s GDP saw the Kiwi take a lift over the 0.66 handle, with quarterly NZ GDP clocking in at 1.0% versus the forecast 0.8% (last 0.5%).
- A firm lower-high pattern on the Daily candles has the NZD/USD heading into a stiff resistance zone near the 50-day EMA, and failure to extend the current bullish play into the 200-day EMA will see the Kiwi-Dollar pairing slumping back from another lower high.
- As the Kiwi breaks upwards of the previous bullish trend, a fallback into previous resistance-turned-support could be on the cards if bulls run out of gas.
| Spot rate | 0.6645 |
| Relative change | 0.51% |
| High | 0.6651 |
| Low | 0.6601 |
| Trend | Bullish |
| Support 1 | 0.6601 (current day low) |
| Support 2 | 0.6578 (200-hour EMA) |
| Support 3 | 0.6538 (current week low) |
| Resistance 1 | 0.6672 (50-day EMA) |
| Resistance 2 | 0.6820 (August peak) |
| Resistance 3 | 0.6909 (200-day EMA) |
