- NZD/USD retraces RBNZ-led gains after China data disappoints Antipodeans.
- 100-day EMA, 38.2% Fibonacci retracement limits near-term upside.
- 0.6320 could follow 50-day EMA.
Given the disappointment from China’s data-dump, NZD/USD extends pullback from near-term key resistance confluence as it trades around 0.6390, the intra-day low, while heading into the European open on Thursday.
China’s October month Industrial Production slipped below 5.4% forecast and 5.8% prior to 4.8% while Retail Sales weakened to 7.2% versus 7.9% expected and 7.8% previous readouts. Also adding to the pair’s weakness is a recent comment from the Reserve Bank of New Zealand (RBNZ) Deputy Governor Bascand who said that the economy needs growth to exceed the potential for inflation.
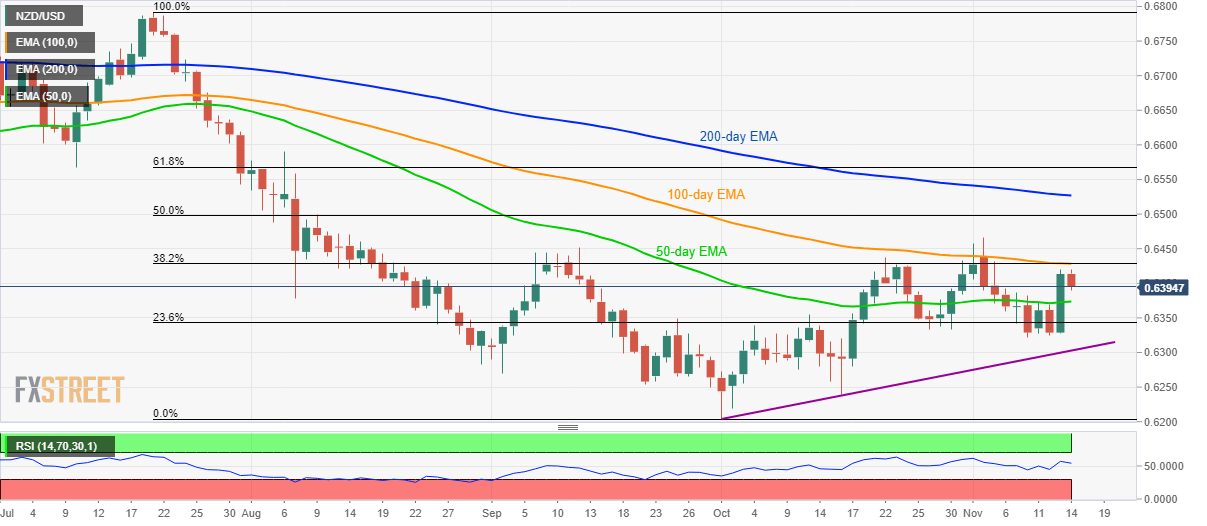
In doing so, a 50-day Exponential Moving Average (EMA) level of 0.6373 acts as immediate support to watch ahead of multiple lows since Friday, around 0.6320, followed by an ascending trend line since October started, around 0.6300.
On the upside, prices need a daily closing beyond 0.6428/30 resistance confluence, comprising 100-day EMA and 38.2% Fibonacci retracement of July-October declines, to aim for monthly top close to 0.6470 and 0.6500 round-figure.
It should also be noted that the pair’s upside past-0.6500 will be challenged by 200-day EMA level of 0.6527.
NZD/USD daily chart
Trend: Pullback expected
