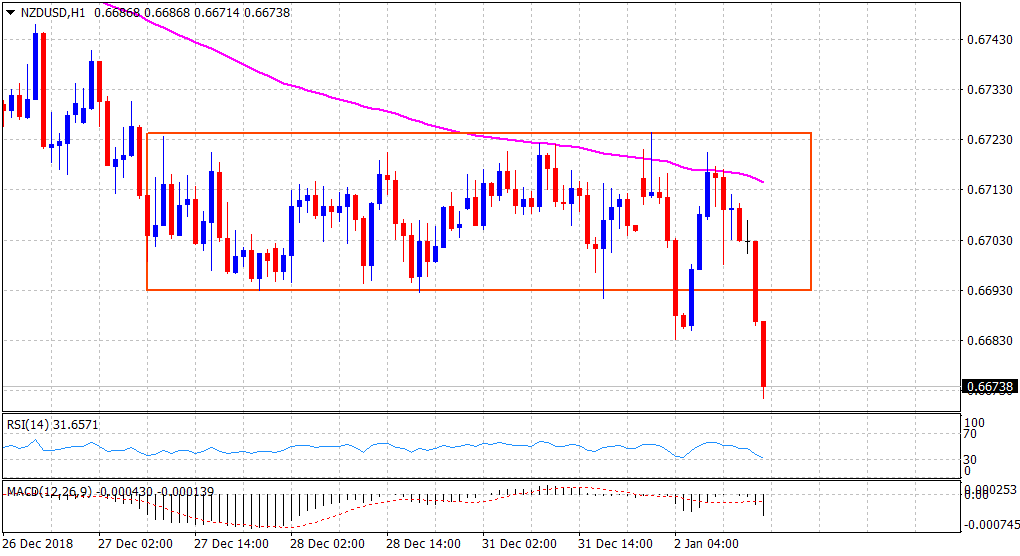
“¢ Having failed to sustain/build on its momentum beyond 100-hour EMA, the pair broke down of its two-day-old consolidation phase to hit near two-month lows in the last hour.
NZD/USD 1-hourly chart
“¢ A sustained break below 50% Fibonacci retracement level of the 0.6424-0.6970 upsurge was seen as a key trigger behind the latest leg of a sharp fall over the past hour or so.
“¢ Currently flirting with 100-day SMA, technical indicators on hourly/daily charts have been gaining negative momentum and support prospects for a fresh bearish breakdown.
Daily chart
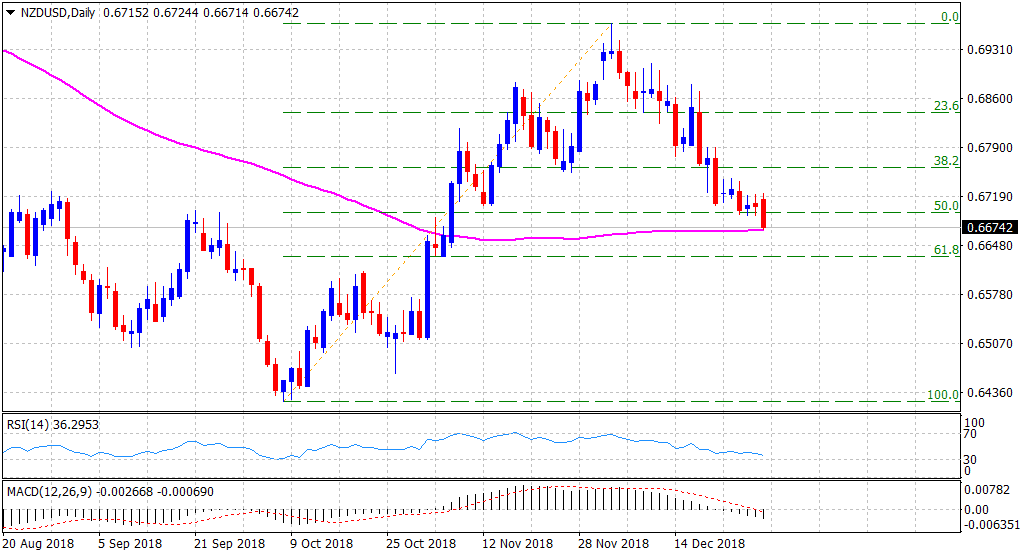
“¢ Hence, a follow-through technical selling, paving the way for an extension of the downfall towards testing 61.8% Fibo. level support now looks a distinct possibility.
NZD/USD
Overview:
Today Last Price: 0.6672
Today Daily change: -47 pips
Today Daily change %: -0.700%
Today Daily Open: 0.6719
Trends:
Previous Daily SMA20: 0.6793
Previous Daily SMA50: 0.676
Previous Daily SMA100: 0.6674
Previous Daily SMA200: 0.6817
Levels:
Previous Daily High: 0.6843
Previous Daily Low: 0.6706
Previous Weekly High: 0.6779
Previous Weekly Low: 0.6692
Previous Monthly High: 0.697
Previous Monthly Low: 0.6686
Previous Daily Fibonacci 38.2%: 0.6791
Previous Daily Fibonacci 61.8%: 0.6758
Previous Daily Pivot Point S1: 0.6669
Previous Daily Pivot Point S2: 0.6619
Previous Daily Pivot Point S3: 0.6532
Previous Daily Pivot Point R1: 0.6806
Previous Daily Pivot Point R2: 0.6893
Previous Daily Pivot Point R3: 0.6943
