- 61.8% Fibonacci retracement and immediate trend-line limits the upside.
- January – April lows can offer nearby support.
The five-week-old descending trend-line and sustained trading beneath 61.8% Fibonacci retracement of October – December 2018 upside portray NZD/USD weakness as it trades around 0.6615 during early Friday.
Immediate attention could be given to January and April’s lows surrounding 0.6590/80 support-zone, a break of which can recall 0.6550 and 0.6510 back on the chart.
In a case of extended downturn beneath 0.6510, 0.6470 and 0.6440 may grab sellers’ attention ahead of October lows near 0.6425.
Meanwhile, 61.8% Fibonacci retracement near 0.6630 could limit nearby advances prior to making buyers challenge 0.6665 trend-line.
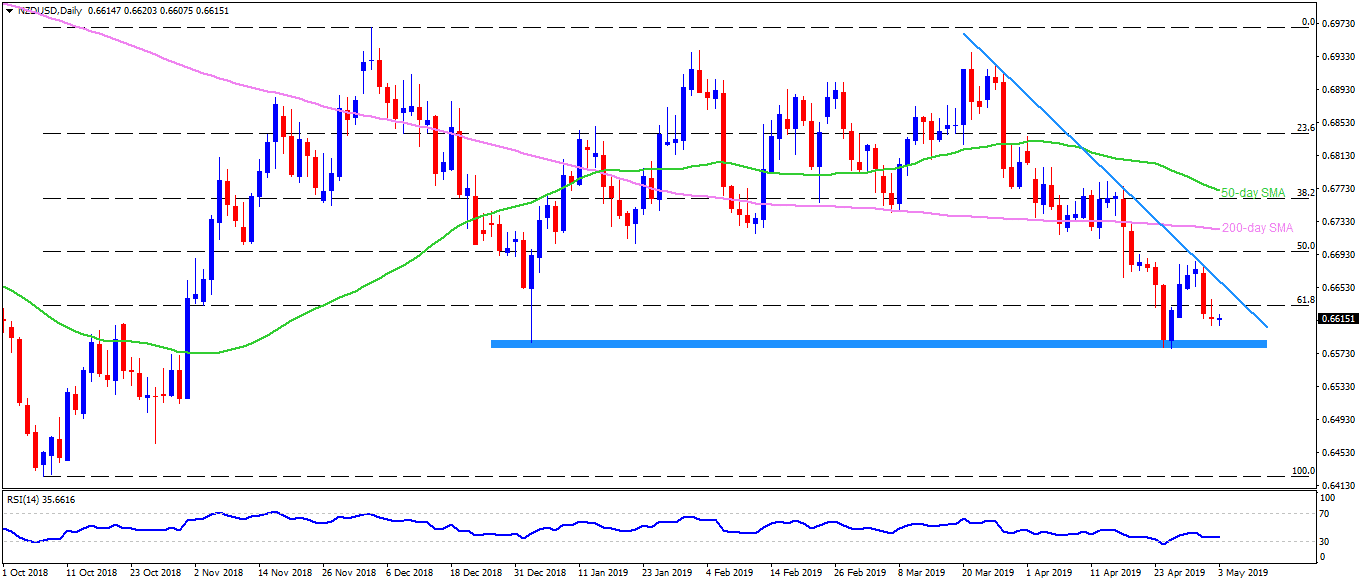
If at all bulls manage to cross 0.6665 upside barrier, 0.6700 and 200-day simple moving average (SMA) near 0.6730 could be on their list whereas 0.6770/75 region comprising 50-day SMA could please them afterward.
NZD/USD daily chart
Trend: Negative
