- The 4-day old descending trend-line questions the NZD/USD pair’s repeated bounces off 0.6440/39 horizontal support.
- 100-hour EMA can challenge upside break while 0.6378 seems near-term strong support.
NZD/USD keeps struggling between a 2-day old horizontal support and an immediate descending resistance-line while taking rounds to 0.6450 ahead of Tuesday’s European session.
Should prices manage to rise past-0.6455 resistance-line 100-hour exponential moving average (EMA) near 0.6475 can challenge additional upside, if not then 0.6500 can flash on the chart.
Meanwhile, a downside break of 0.6440/39 support could recall 0.6410 and 0.6378 on sellers’ radar.
In a case, the quote slips under 0.6378, the year 2016 low near 0.6348 can offer an intermediate halt to pair’s plunge towards sub-0.6300 support.
NZD/USD hourly chart
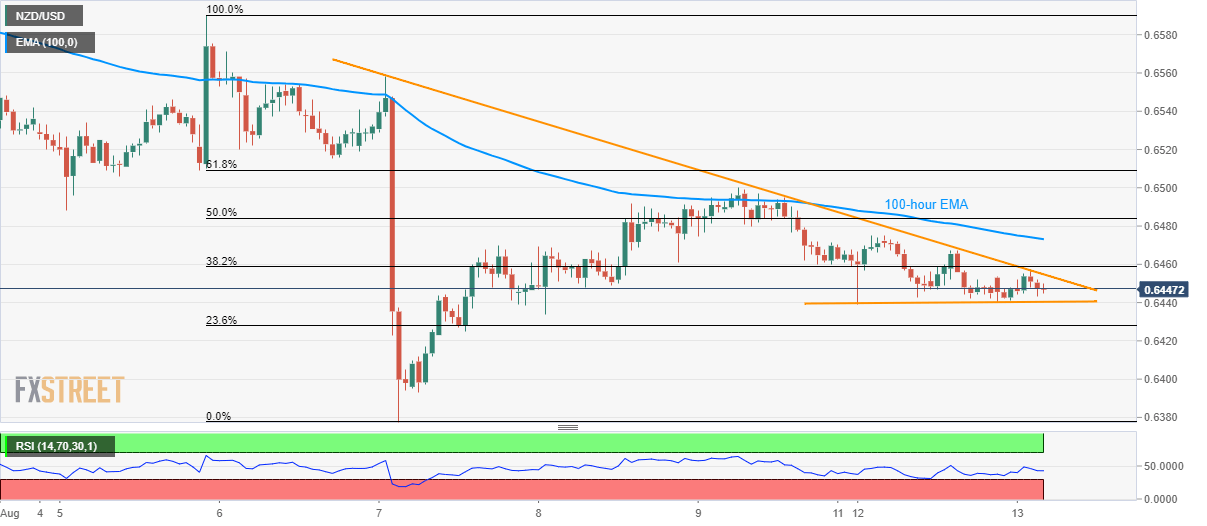
Trend: Bearish
