- The Kiwi continues to trade to the downside after last week’s steady decline from 0.6670, the pair’s current one-month high.
- The Kiwi’s long-term bearish trend remains firmly intact on Daily candles, with the pair recently being rejected from the 50-day EMA, and the shortside target will be at 2018’s floor at the 0.6500 handle.
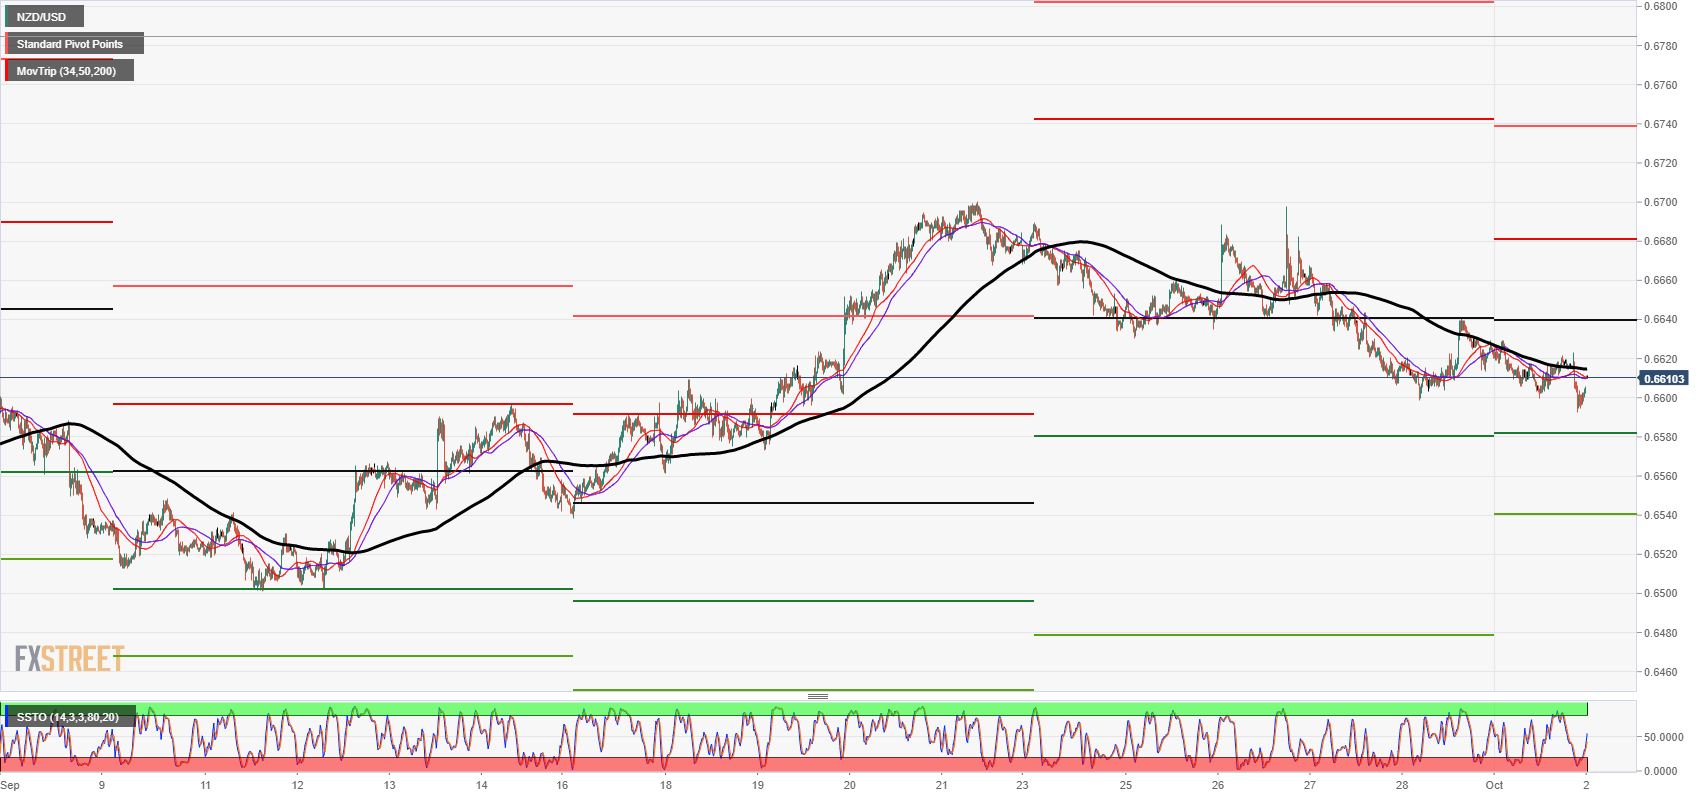
| Spot rate | 0.6610 |
| Current week change | Negligible |
| Previous week high | 0.6696 |
| Previous week low | 0.6598 |
| Support 1 | 0.6593 (current week low) |
| Support 2 | 0.6581 (S1 weekly pivot) |
| Support 3 | 0.6540 (S2 weekly pivot) |
| Resistance 1 | 0.6628 (current week high) |
| Resistance 2 | 0.6670 (one-month high) |
| Resistance 3 | 0.6700 (major technical level) |
