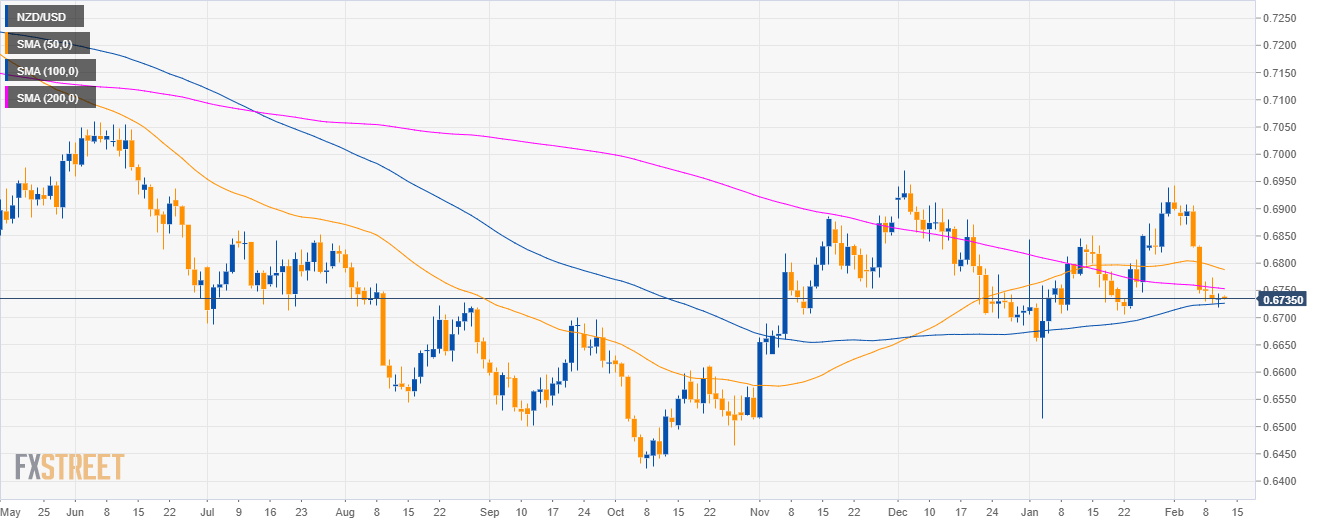
NZD/USD daily chart
- NZD/USD is trading between the 100 and 200-day simple moving average (SMAs).
- The Reserve Bank of New Zealand (RBNZ) will release its interest rate decision and monetary policy statement at 1.00 GMT. This can lead to high volatility in the NZD/USD currency pair.
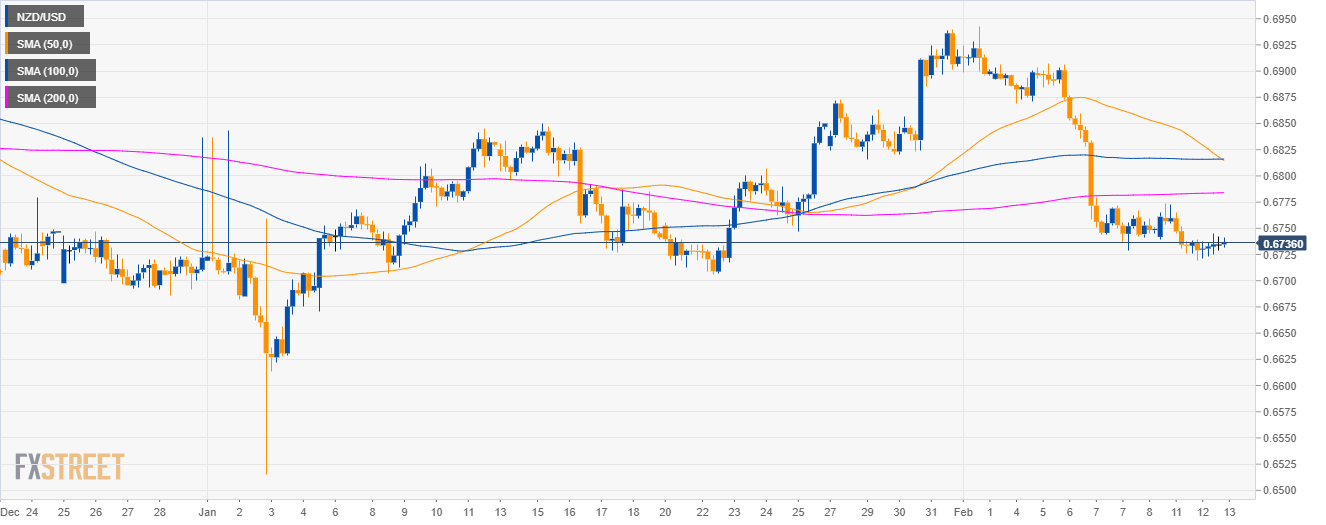
NZD/USD 4-hour chart
- NZD/USD is trading below its main SMAs suggesting bearish momentum in the medium-term.
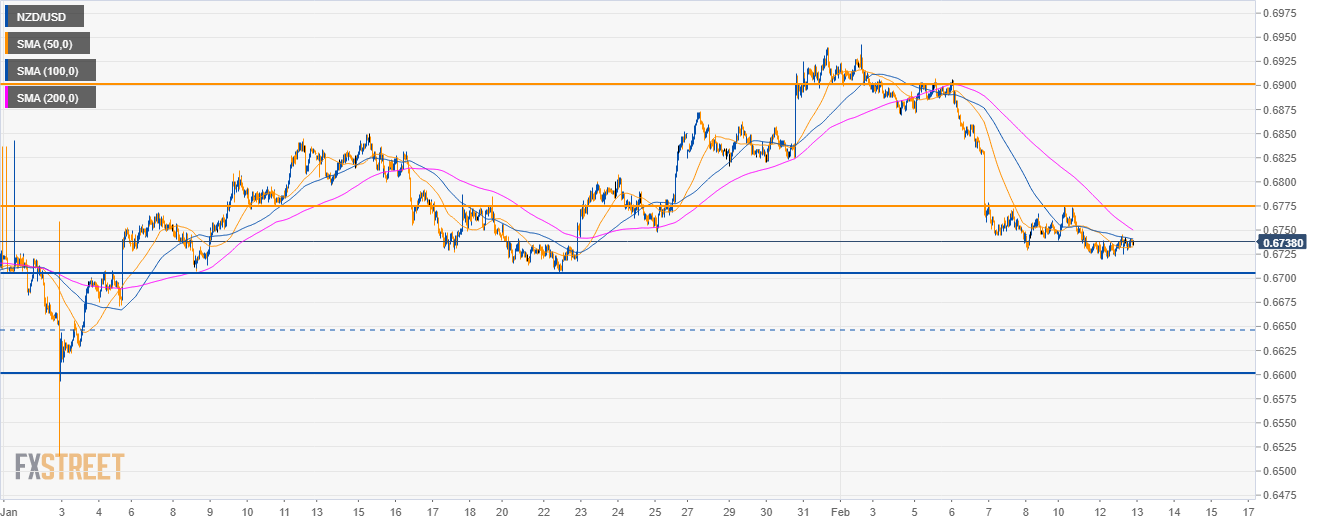
NZD/USD 30-minute chart
- NZD/USD is trading below its 200 SMA suggesting bearish momentum in the short-term.
- Bears have to break below 0.6710 in order to travel towards 0.6645 and 0.6600 support.
- On the flip side, if bulls break 0.6775 they can drive the market all the way up to 0.6900 figure.
Additional key levels
NZD/USD
Overview:
Today Last Price: 0.6737
Today Daily change: 2 pips
Today Daily change %: 0.03%
Today Daily Open: 0.6735
Trends:
Daily SMA20: 0.6809
Daily SMA50: 0.6795
Daily SMA100: 0.6725
Daily SMA200: 0.6756
Levels:
Previous Daily High: 0.6774
Previous Daily Low: 0.6726
Previous Weekly High: 0.6907
Previous Weekly Low: 0.6729
Previous Monthly High: 0.694
Previous Monthly Low: 0.6516
Daily Fibonacci 38.2%: 0.6744
Daily Fibonacci 61.8%: 0.6756
Daily Pivot Point S1: 0.6716
Daily Pivot Point S2: 0.6697
Daily Pivot Point S3: 0.6668
Daily Pivot Point R1: 0.6764
Daily Pivot Point R2: 0.6793
Daily Pivot Point R3: 0.6812
