Home NZD/USD Technical Analysis: Kiwi slumps into 0.69, bullish opportunities are looking thin
FXStreet News

NZD/USD Technical Analysis: Kiwi slumps into 0.69, bullish opportunities are looking thin

  • Kiwi fails to develop a bounce from Tuesday’s decline, hourly indicators are heading higher with little bullish momentum.
  • Economic calendar is fairly clear for Wednesday.
  • Overall market sentiment remains hesitant amidst trade war tensions.
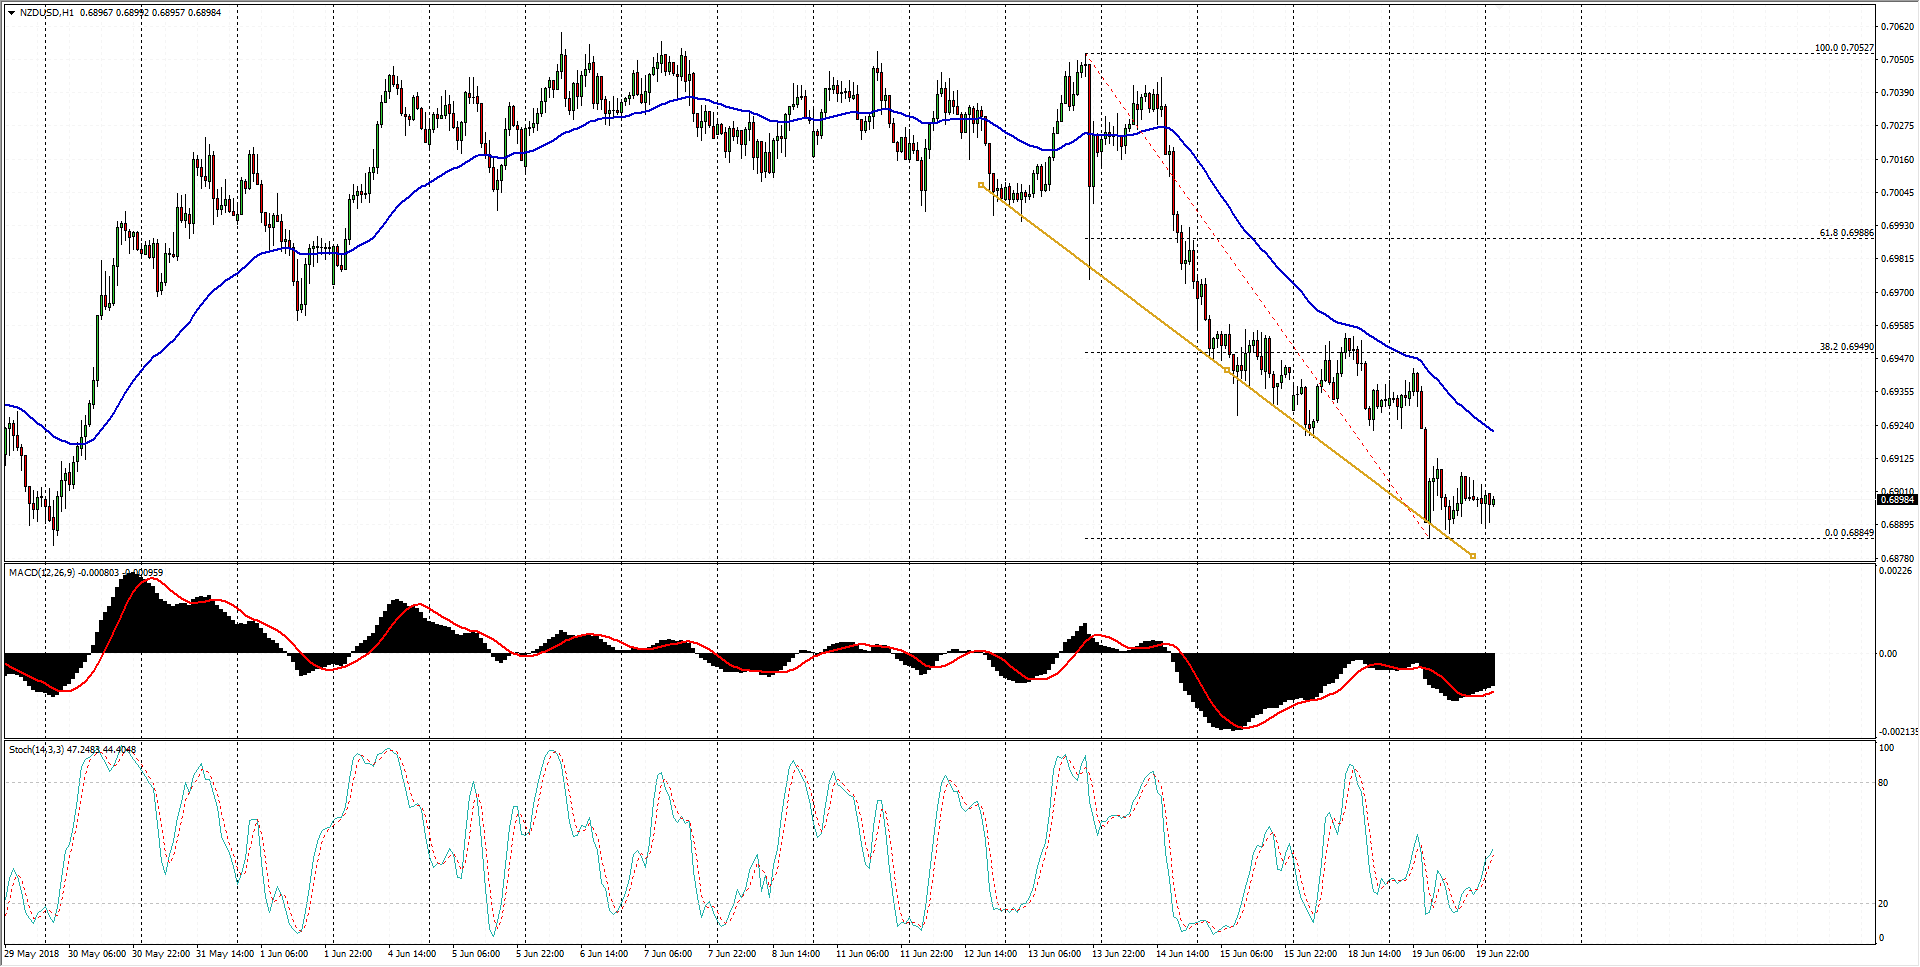
NZD/USD Chart, 1-Hour

Spot rate:             0.6898
Relative change: Negligible
High:                    0.6900
Low:                     0.6888

Trend:                  Bearish

Support 1:            0.6884 (current week low)  
Support 2:            0.6850 (May bottom)
Support 3:            0.6771 (S3 1-week pivot)

Resistance 1:       0.6949 (38.2% Fibo retracement leve)
Resistance 2:       0.6980 (61.8% Fibo retracement level)
Resistance 3:       0.7060 (May high)

FX Street

FX Street

FXStreet is the leading independent portal dedicated to the Foreign Exchange (Forex) market. It was launched in 2000 and the portal has always been proud of their unyielding commitment to provide objective and unbiased information, to enable their users to take better and more confident decisions.