- Kiwi bullish momentum is intact in the New York session.
- The level to beat for bulls is the 0.6415 resistance.
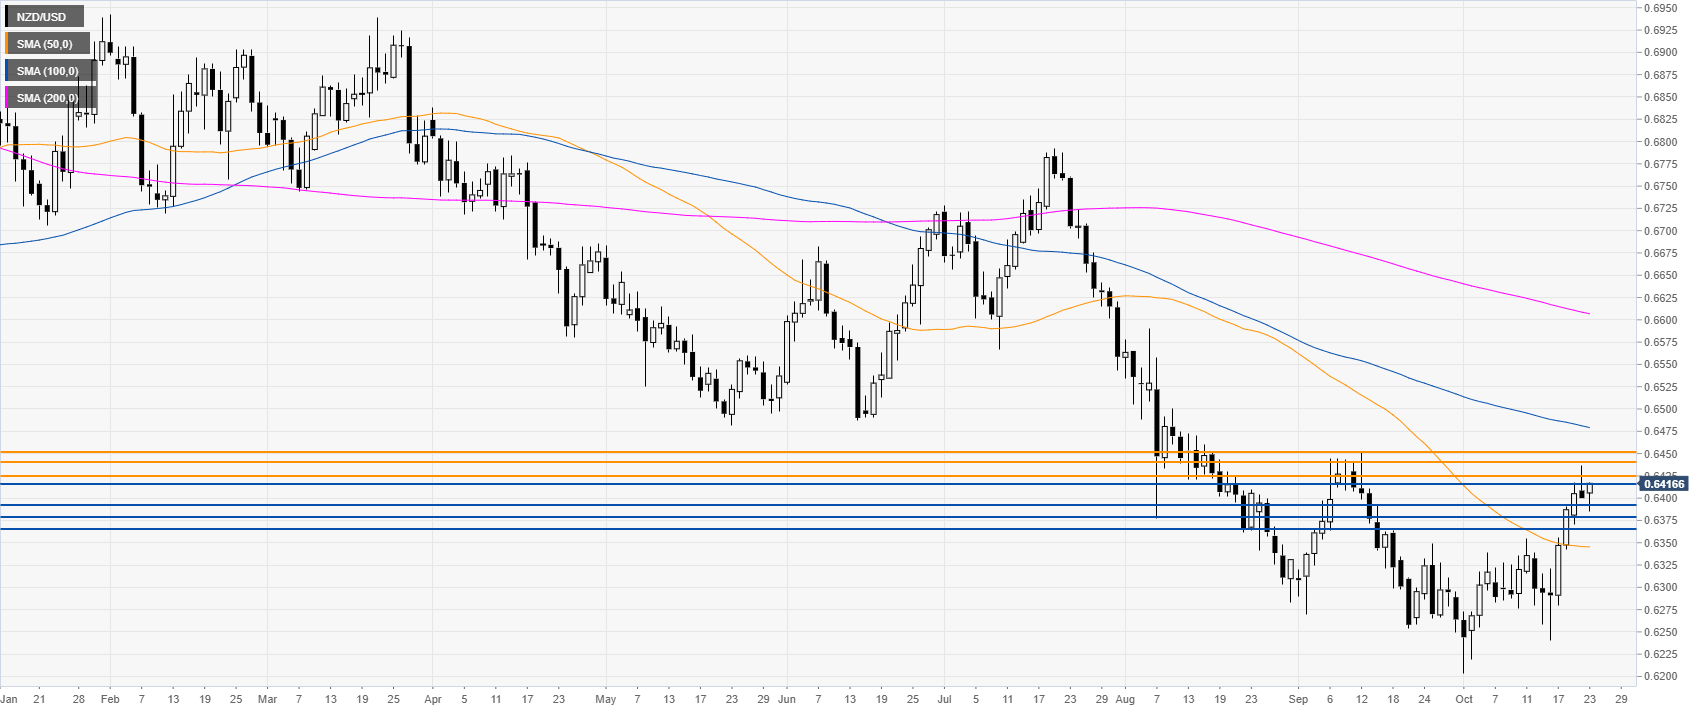
NZD/USD daily chart
The Kiwi has been spiking ups in October above its 50-day simple moving averages (SMAs). The rebound is seen as corrective below the September high.
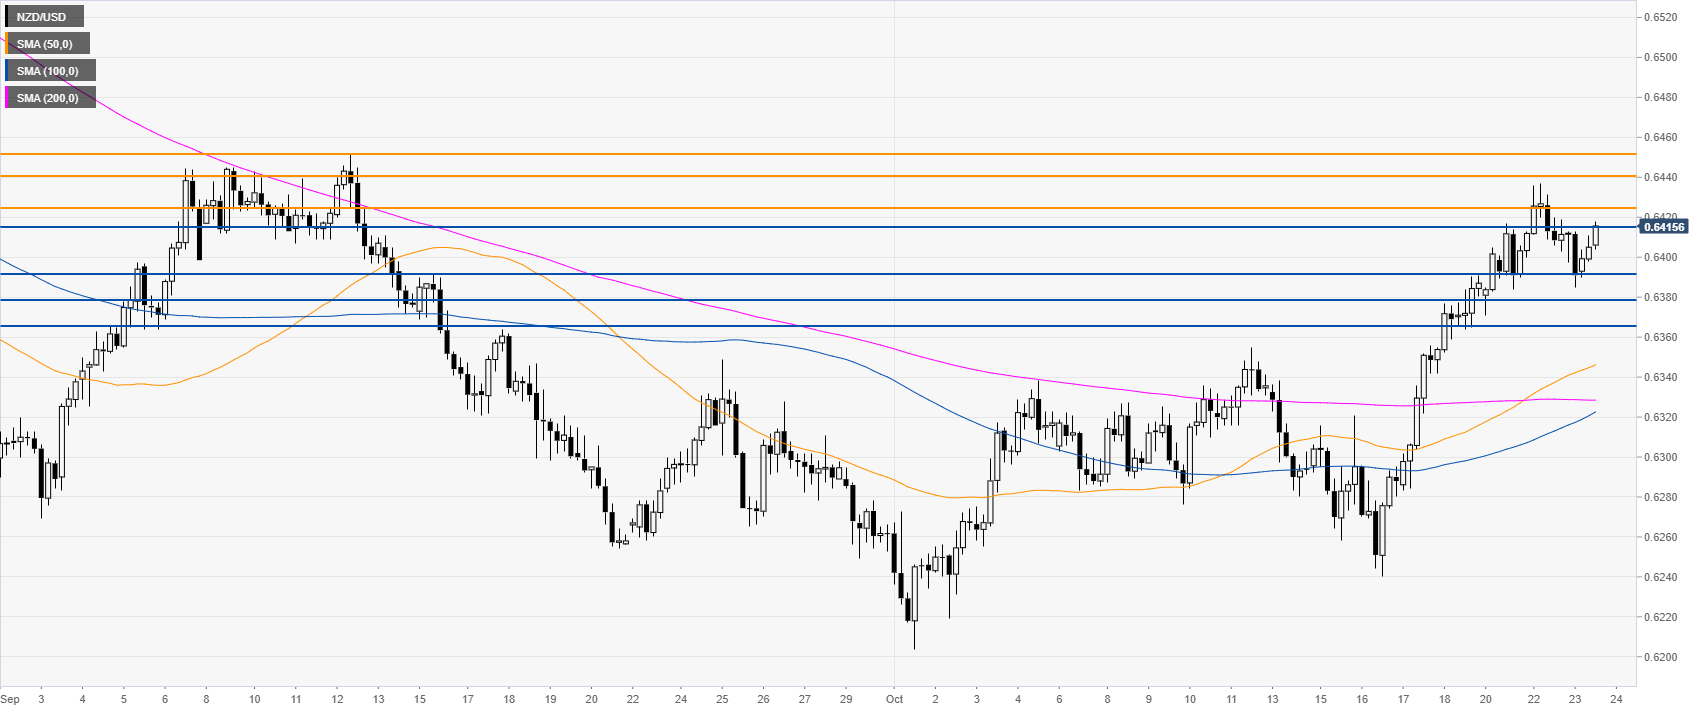
NZD/USD four-hour chart
NZD/USD is trading in a bull leg above its main SMAs. After a brief pullback down, the bulls are lifting the spot above the 0.6400 handle one more time.
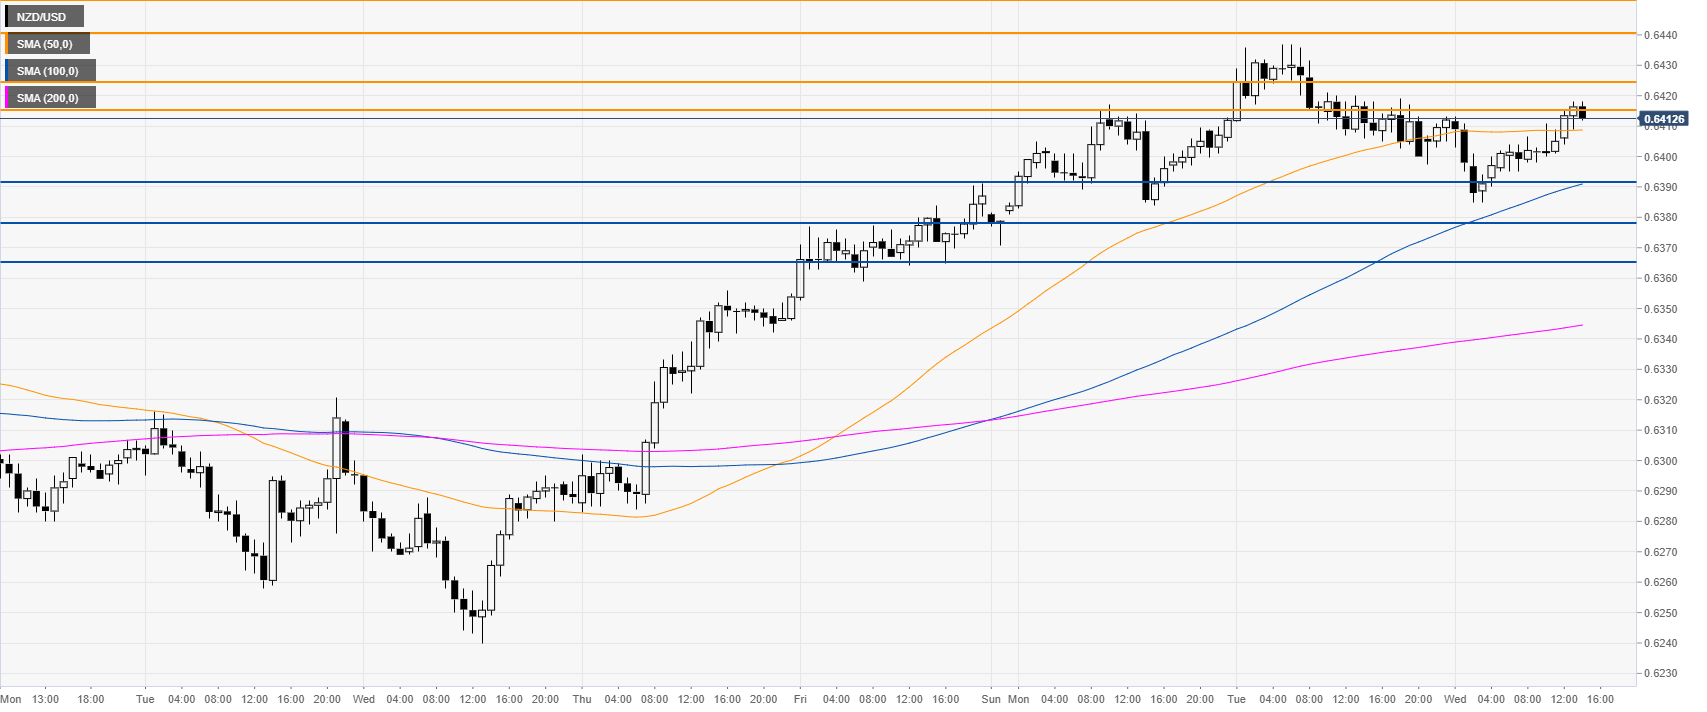
NZD/USD 30-minute chart
The Kiwi is trading above its main SMAs, suggesting bullish momentum in the near term. The market is currently challenging the 0.6415 resistance. If broken, the next levels to watch become the 0.6424, 0.6440 and 0.6451 price levels on the way up, according to the Technical Confluences Indicator.
Support is seen at the 0.6378 and 0.6351 levels.
Additional key levels
