- NZD/USD fails to hold onto recovery gains from near-term support line.
- Bulls remain dominant above 200-day SMA.
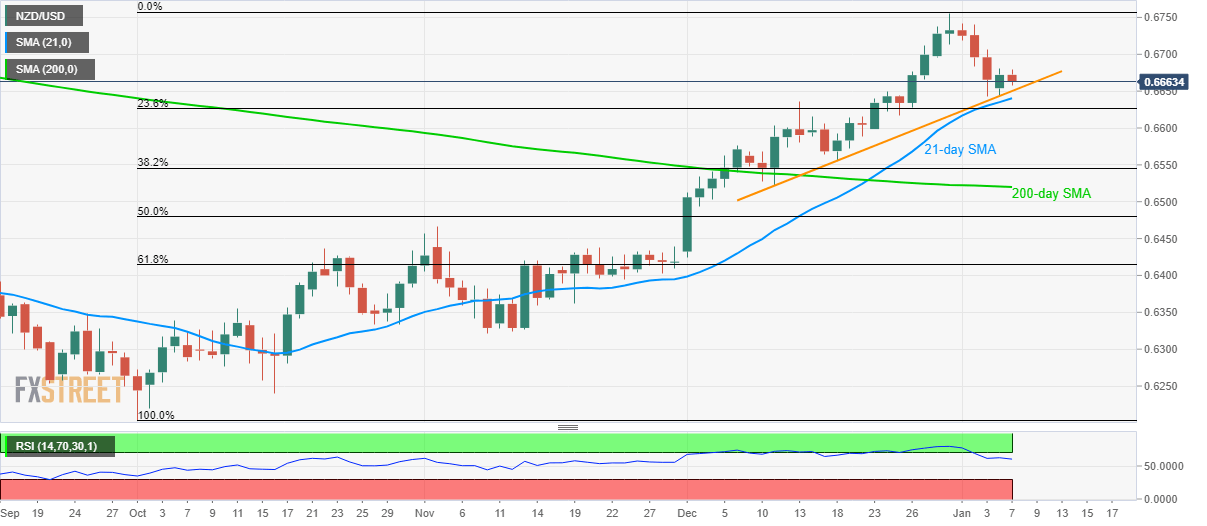
NZD/USD declines to 0.6660 during early Tuesday. In doing so, the pair reverses most of its Monday’s gains while nearing the key short-term support levels.
An upward sloping trend line since December 11 at 0.6650 and a 21-day SMA level of 0.6640 are likely immediate rest-points to watch during further downside.
However, the Bull’s dominance can’t be denied unless NZD/USD prices slip below a 200-day SMA level of 0.6520. Following that, sellers can take aim on November month high near 0.6466.
On the upside, pair’s rise beyond the low of December 31 near 0.6712 will trigger fresh run-up towards the latest high of 0.6756.
Additionally, July 2019 high near 0.6792 and 0.6800 round-figure can lure the buyers if the pair manages to stay strong above 0.6756.
NZD/USD daily chart
Trend: Bullish
