- 9-day old descending trend-line portrays the NZD/USD pair’s weakness.
- Rising trend-line from late-2018 becomes strong support amid oversold RSI.
With short-term descending trend-line continues exerting downside pressure on the NZD/USD pair, the quote drops to 0.6540 during early Friday.
The pair now aims to a visit a 10-month ascending trend-line stretched since October 2018, at 0.6500 now. Though, 0.6515 can offer an intermediate halt.
In a case, prices refrain from respecting oversold conditions of 14-day relative strength index (RSI) and slip beneath 0.6500 mark, May month low near 0.6480 could be on the sellers’ radar.
On the upside, pair’s break of 0.6575 trend-line resistance can trigger fresh buying interest towards 0.6600 round-figure and then to 50-day simple moving average (SMA) whereas 61.8% Fibonacci retracement of October – November 2018, at 0.6634, will please buyers afterward.
NZD/USD daily chart
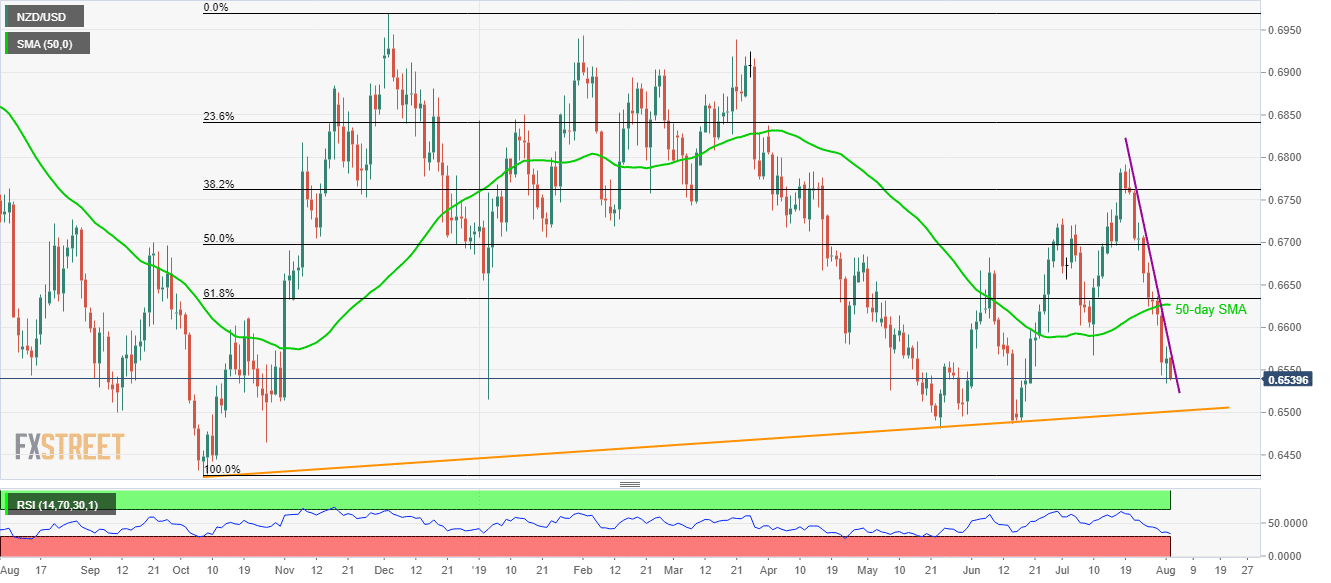
Trend: Bearish
