- NZD/USD declines to fresh low since September 2015 with bearish MACD.
- The four-year low, near 0.6236, multi-month old falling trend-lines gain bears’ attention for now.
NZD/USD extends its southward trajectory to multi-year low while flashing 0.6274 during early Tuesday’s Asian session.
Considering bearish signals from 12-bar moving average convergence and divergence (MACD) indicator, prices are likely declining towards September 2015 low of 0.6236 whereas a downward-sloping trend-line since May 2017, near 0.6170, will gain sellers attention then after.
In case prices keep trading southwards below 0.6170, the year 2015 bottom surrounding 0.6084 and another falling trend-line, since November 2017, around 0.6050 will be in the spotlight.
Alternatively, 0.6300 and January 2016 low near 0.6348/50 can please buyers during the pullback while October 2018 bottom close to 0.6425 and May month trough of 0.6481 could entertain bulls afterward.
NZD/USD weekly chart
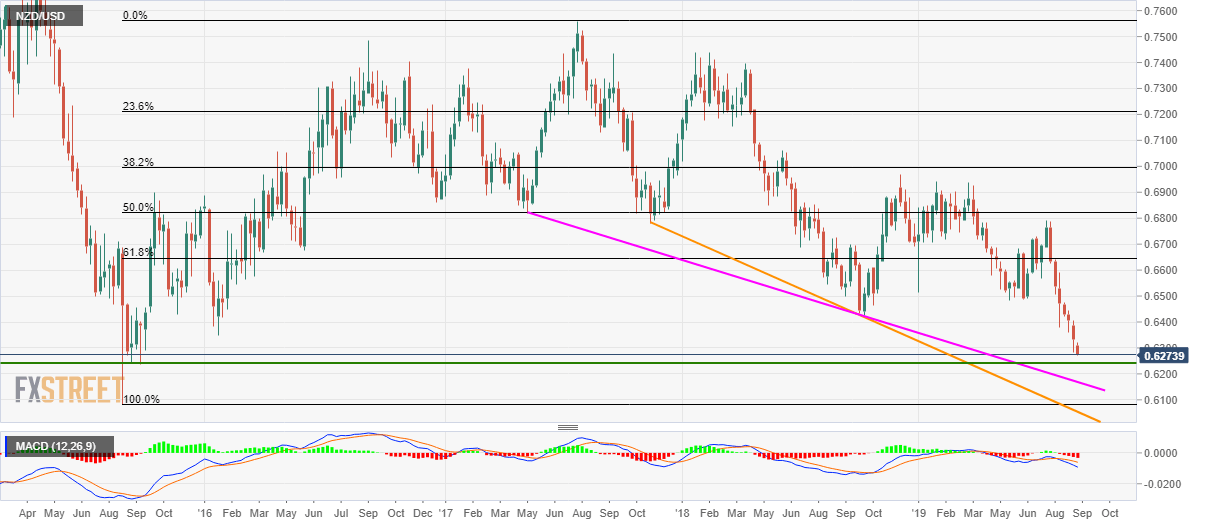
Trend: bearish
