- NZD/USD fails to cross 0.6427/30 resistance confluence.
- A two-month-old rising channel portrays overall bullish sentiment.
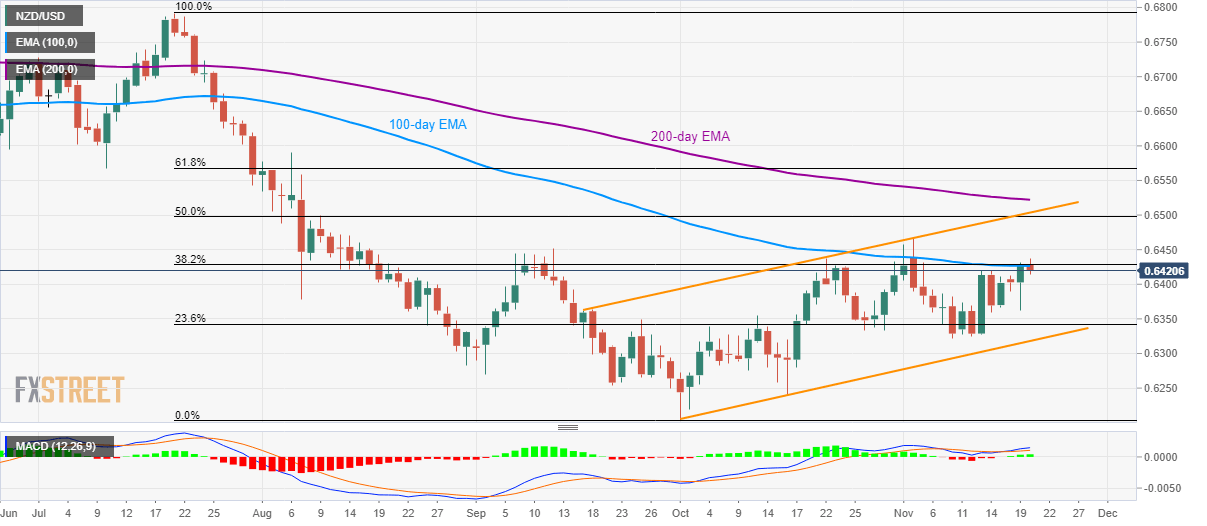
NZD/USD again steps back from 100-day EMA, accompanied by 38.2% Fibonacci retracement, while taking rounds to 0.6420 during early Wednesday.
The quote can now aim for 0.6360 during further declines while 23.6% Fibonacci retracement of July-October downpour and the lower line of an ascending trend channel since late-September, around 0.6340 and 0.6320 respectively, could entertain sellers afterward.
If at all bears dominate below 0.6320, mid-October low near 0.6240 and 0.6200 round-figure, including the previous month bottom, will be in the spotlight.
On the contrary, the pair’s sustained break above 0.6430 enables it to challenge the monthly tops near 0.6470. Though, 50% Fibonacci retracement and the resistance of the aforementioned channel could challenges buyers near 0.6500/05.
Adding to the upside barriers is the 200-day Exponential Moving Average (EMA) level of 0.6423.
NZD/USD daily chart
Trend: Pullback expected
