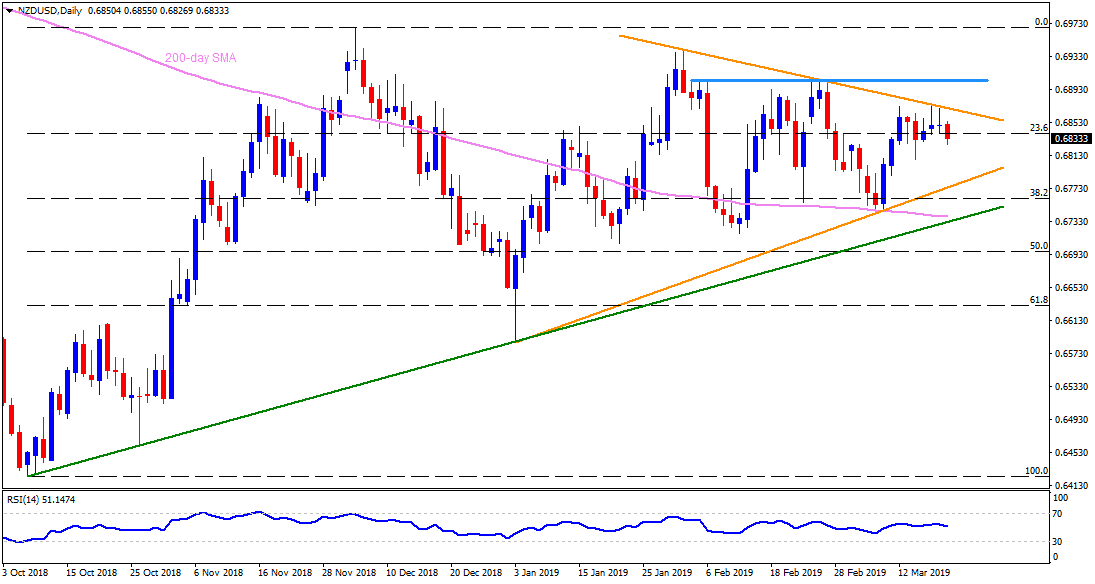
NZD/USD daily chart NZD/USD is trading near 0.6830 during early Wednesday. The quote reversed from seven-week-old descending resistanceline on Tuesday while its dip beneath immediate trend-line support validates further downside. In doing so 0.6810/05 area comprising March 13 low and March 08 high is likely immediate support, a break of which can magnify the weakness towards an upward sloping suppportline stretched since early-January at 0.6770. However 200-day simple moving average (SMA) at 0.6735, followed by five-month-old ascending trend-line at 0.6730, could limit further declines. Alternatively, sustained break of 0.6875 becomes prerequisite for pair to mark a recovery in a direction to 0.6905/10 resistance region. Also, the pair’s extended rise above 0.6910 enables it to aim for 0.6940, 0.6975 and 0.7000. 
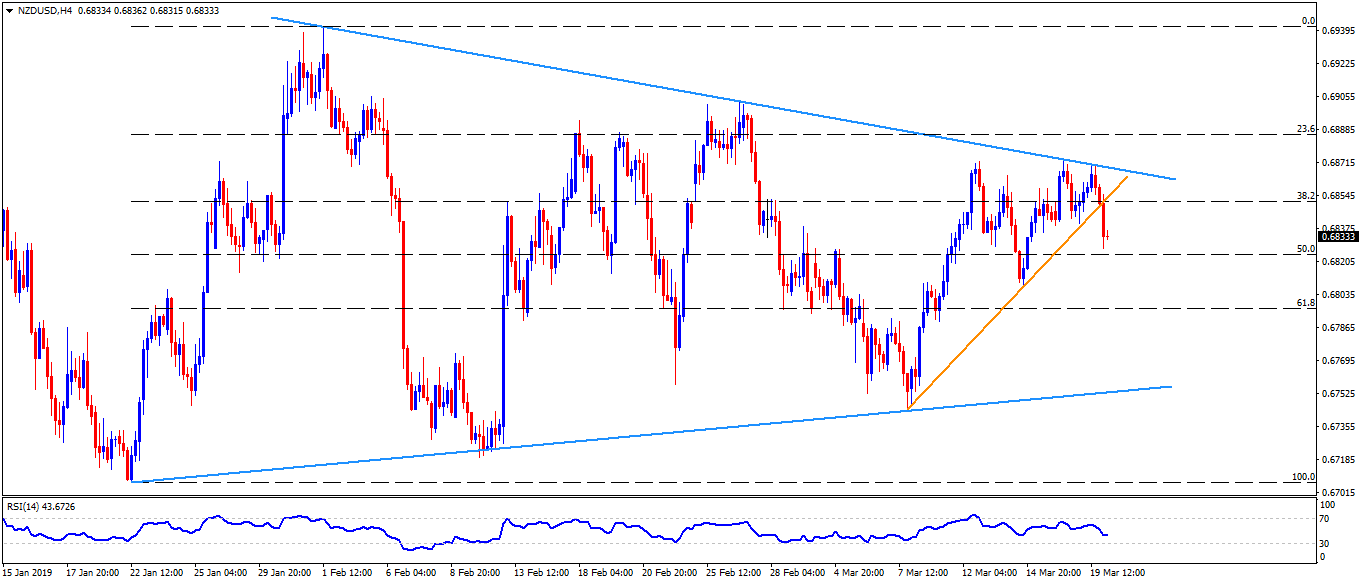
NZD/USD 4-Hour chart An intermediate ascending support-line at 0.6755 can try restricting pair’s slip below 0.6770 towards 0.6735. 0.6925 seems a small stop in between 0.6910 and 0.6940. 
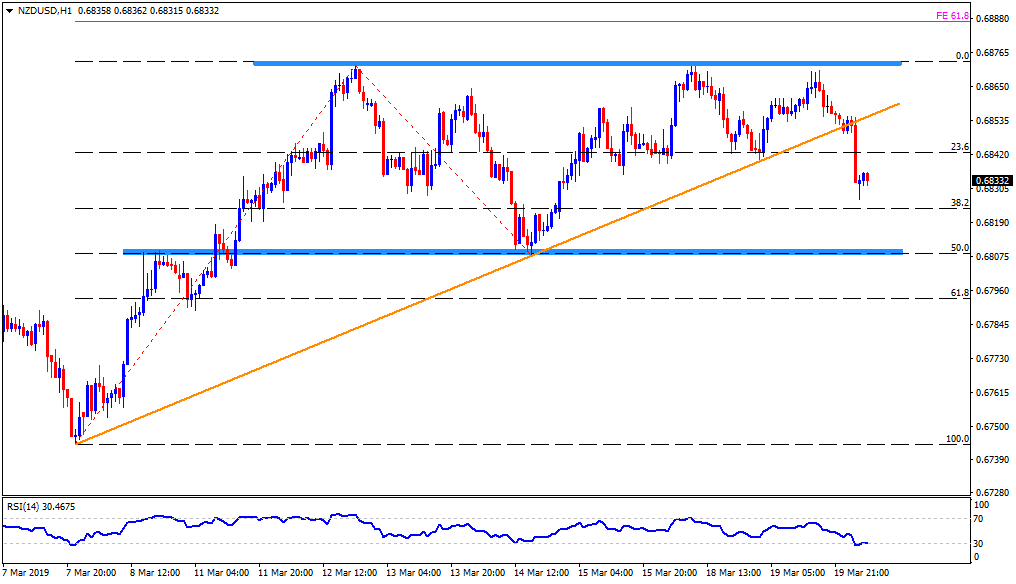
NZD/USD hourly chart 0.6790 could appear as a support after 0.6805 in a direction to 0.6770. Also, 0.6890 might entertain short-term buyers beyond 0.6875. FX Street FX Street FXStreet is the leading independent portal dedicated to the Foreign Exchange (Forex) market. It was launched in 2000 and the portal has always been proud of their unyielding commitment to provide objective and unbiased information, to enable their users to take better and more confident decisions. View All Post By FX Street FXStreet News share Read Next Crypto Exchange Bithumb downsizing by 50% FX Street 4 years NZD/USD daily chart NZD/USD is trading near 0.6830 during early Wednesday. The quote reversed from seven-week-old descending resistanceline on Tuesday while its dip beneath immediate trend-line support validates further downside. In doing so 0.6810/05 area comprising March 13 low and March 08 high is likely immediate support, a break of which can magnify the weakness towards an upward sloping suppportline stretched since early-January at 0.6770. However 200-day simple moving average (SMA) at 0.6735, followed by five-month-old ascending trend-line at 0.6730, could limit further declines. Alternatively, sustained break of 0.6875 becomes prerequisite for pair to mark a recovery in a direction… Regulated Forex Brokers All Brokers Sponsored Brokers Broker Benefits Min Deposit Score Visit Broker 1 $100T&Cs Apply 0% Commission and No stamp DutyRegulated by US,UK & International StockCopy Successfull Traders 9.8 Visit Site FreeBets Reviews$100Your capital is at risk. 2 T&Cs Apply 9.8 Visit Site FreeBets Reviews$100Your capital is at risk. 3 Recommended Broker $100T&Cs Apply No deposit or withdrawal feesTrade major forex pairs such as EUR/USD with leverage up to 30:1 and tight spreads of 0.9 pips Low $100 minimum deposit to open a trading account 9 Visit Site FreeBets ReviewsYour capital is at risk. 4 T&Cs Apply Visit Site FreeBets ReviewsYour capital is at risk. 5 Recommended Broker $0T&Cs Apply Trade gold, silver, and platinum directly against major currenciesUp to 1:500 leverage for forex trading24/5 customer service by phone and email 9 Visit Site FreeBets ReviewsYour capital is at risk.