NZD/USD clings to 0.6685 during early Friday with most global markets closed due to Good Friday recess.
The quote’s sustained dip beneath 0.6710 – 0.6700 horizontal-support comprising lows market since January 08 highlights the importance of 61.8% Fibonacci retracement of its October –
December upswing, at 0.6630. However, 0.6650 may act as an intermediate halt.
Should prices slip under 0.6630, 0.6600, 0.6585 and 0.6570 could flash on the Bears’ radar whereas 0.6510 and 0.6490 could challenge them afterward.
Alternatively, a successful break of 0.6710 becomes necessary for the pair to aim for 200-day simple moving average (SMA) figure of 0.6735 and 38.2% Fibonacci retracement near 0.6760.
If buyers manage to conquer 0.6760, 0.6780 and 0.6800-0.6805 area including 50-day and 100-day SMAs could become next landmarks for them.
NZD/USD daily chart
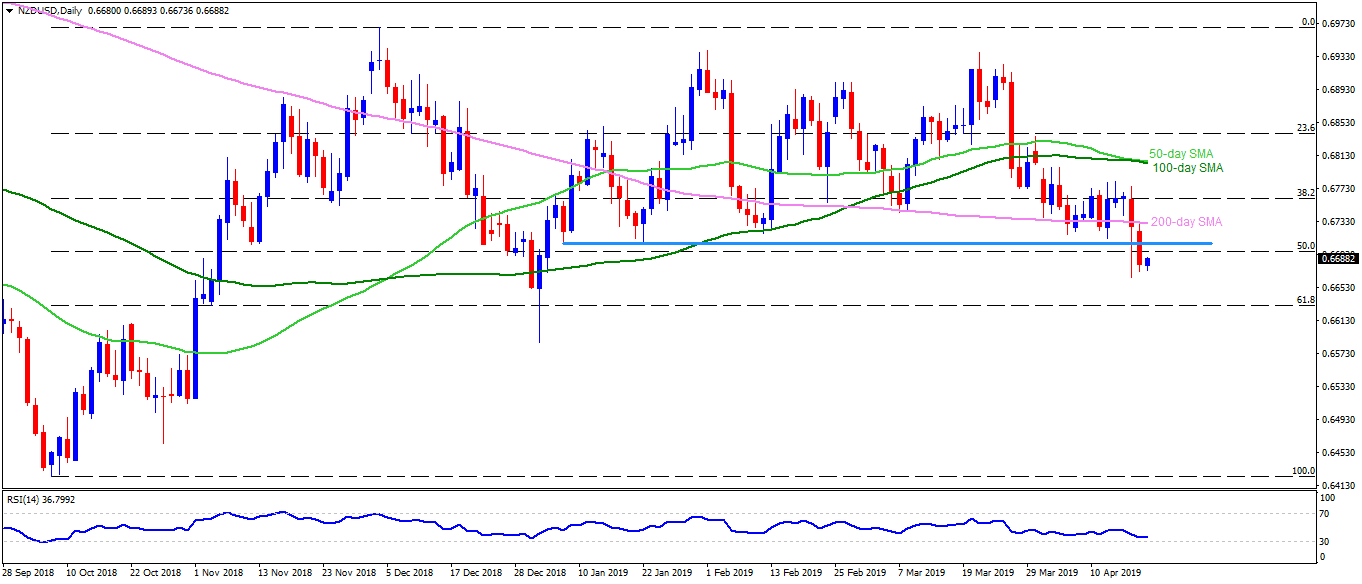
Trend: Bearish
