- NZD/USD slips below 23.6% Fibonacci retracement.
- The bearish technical formation, MACD conditions keep sellers hopeful.
- Monthly top acts as the nearby key resistance.
The NZD/USD pair’s declines below 23.6% Fibonacci retracement pushes sellers to look for confirmation of the bearish chart pattern as the quote seesaws near 0.6410 during early Thursday.
Not only the support line of nearly seven-day-old rising wedge formation but 38.2% Fibonacci retracement of October-November upside also increases the importance of 0.6380 as the key rest-point.
With the 12-bar Moving Average Convergence and Divergence (MACD) flashing bearish signals, odds are high for the pair’s slip beneath 0.6380, which in turn will open the door for extend south-run towards October 16 low of 0.6240. Though, 61.8% Fibonacci retracement level of 0.6326 can offer an intermediate halt during the declines.
Meanwhile, pair’s run-up beyond 0.6445 will negate the bearish formation and can propel prices to challenge the recent high surrounding 0.6470 ahead of taking aim at 0.6500.
NZD/USD 4-hour chart
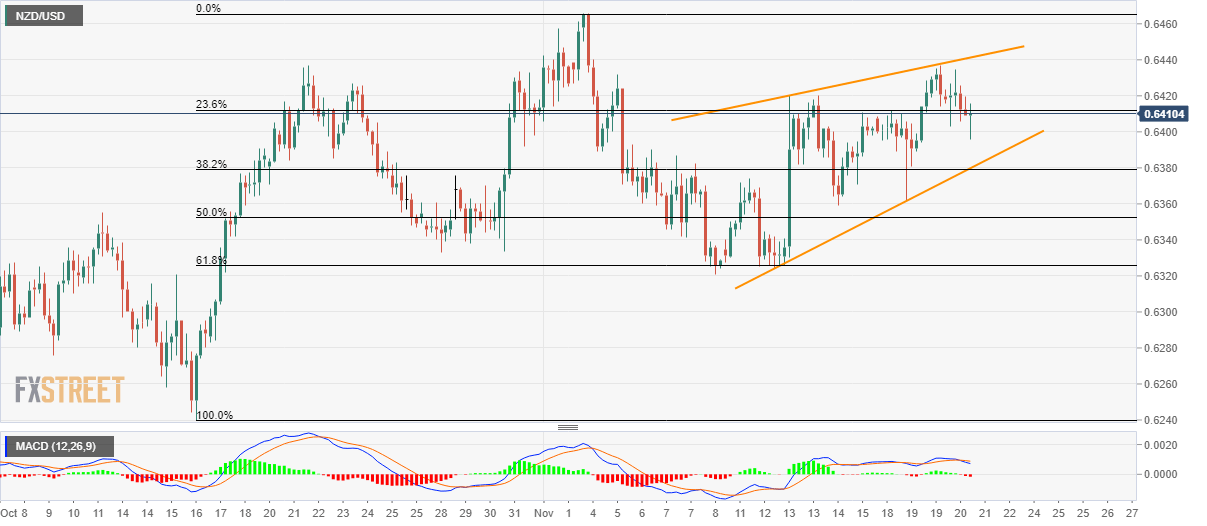
Trend: Bearish
