- 5, 10-day moving average (MA) bullish crossover confirmed, the NZD/USD daily chart shows.
- The MA crossover indicates a short-term bullish trend reversal in NZD/USD.
NZD/USD Daily chart
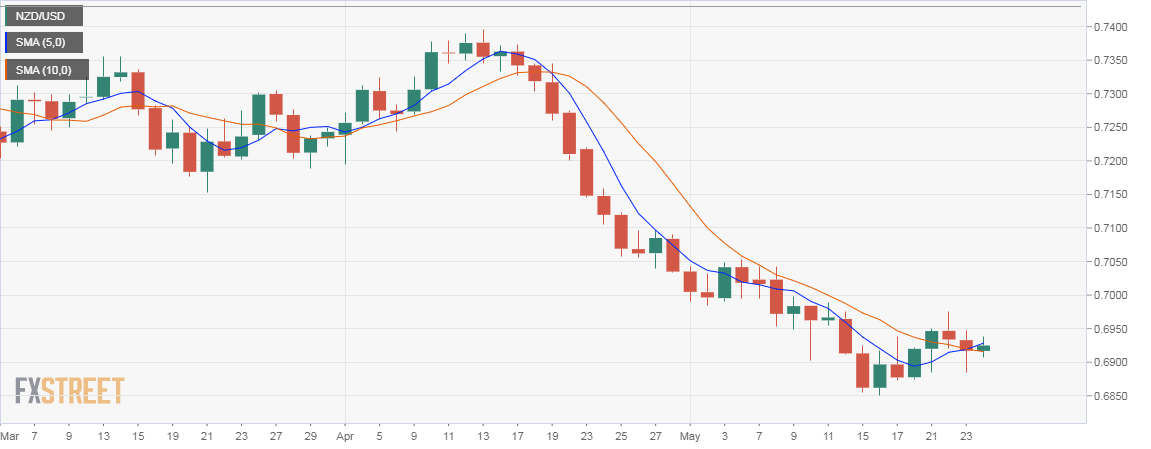
Spot rate: 0.6928
Daily Change: +0.14 percent
Daily high: 0.6937
Daily low: 0.6906
Trend: Bullish
Resistance
- 0.6974 (May 22 high)
- 0.70 (psychological level)
- 0.7053 (May 4 high)
Support
- 0.6915 (10-day MA)
- 0.6871 (May 17 low)
- 0.6851 (May 16 low)
The 5-day MA has crossed the 10-day MA in an NZD-positive manner, signaling a short-term bullish-to-bearish trend change. A similar crossover was seen in early April and had yielded a 140-pip rally in NZD/USD. NZD/USD could test immediate resistance located at 0.6974 (May 22 high).
