- NZD/USD’s close at 0.6550 activated twin bullish cues.
- The daily chart looks constructive for a break above 0.6580.
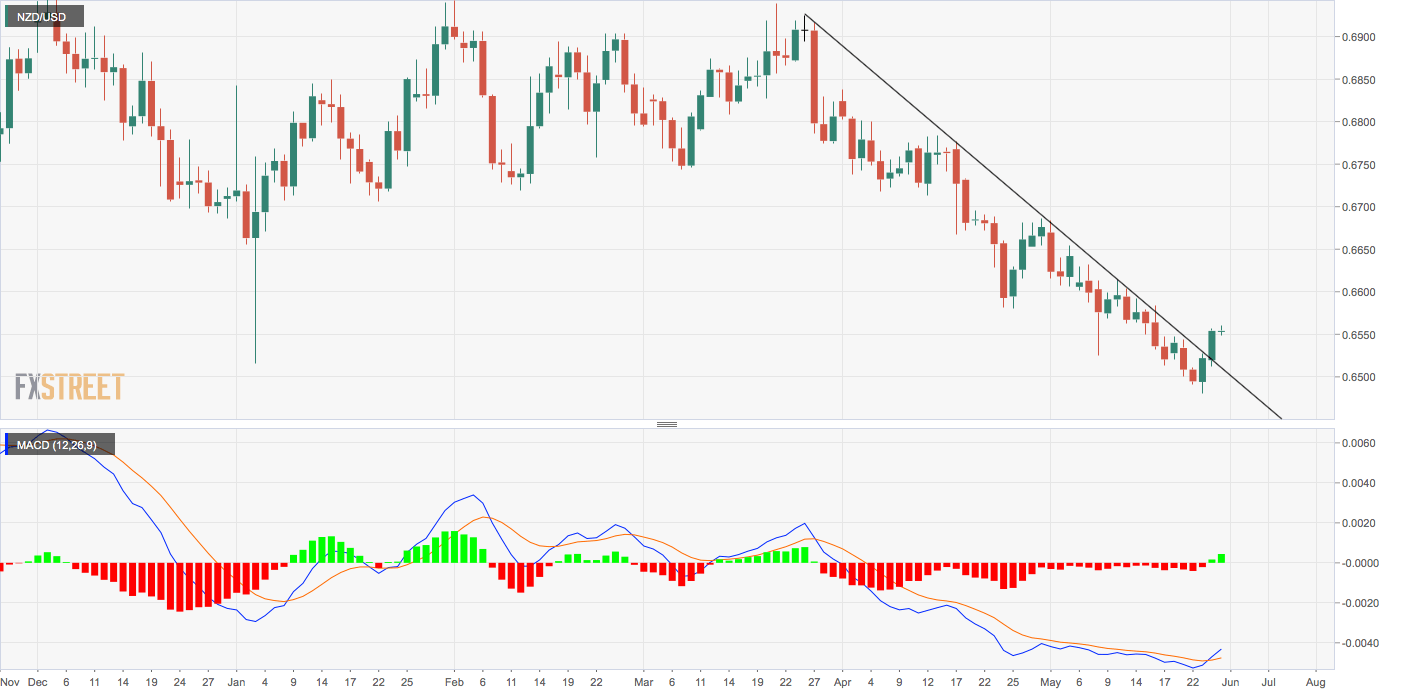
NZD/USD closed at 0.6550 on Friday, confirming an upside break of the trendline connecting March 26 and April 17 high. Also, a close at 0.6550 validated Thursday’s bullish outside day candle.
That coupled with the moving average convergence divergence (MACD) histogram’s bullish turn indicates scope for a rise above the immediate resistance of 0.6580 (April 25 low).
As of now, the pair is trading at 0.6553, having hit a high of 0.6559 – a level last seen on May 16.
The bullish setup would be invalidated if the spot closes today below 0.6512 (Friday’s low).
Daily chart
Trend: Bullish
Pivot points
