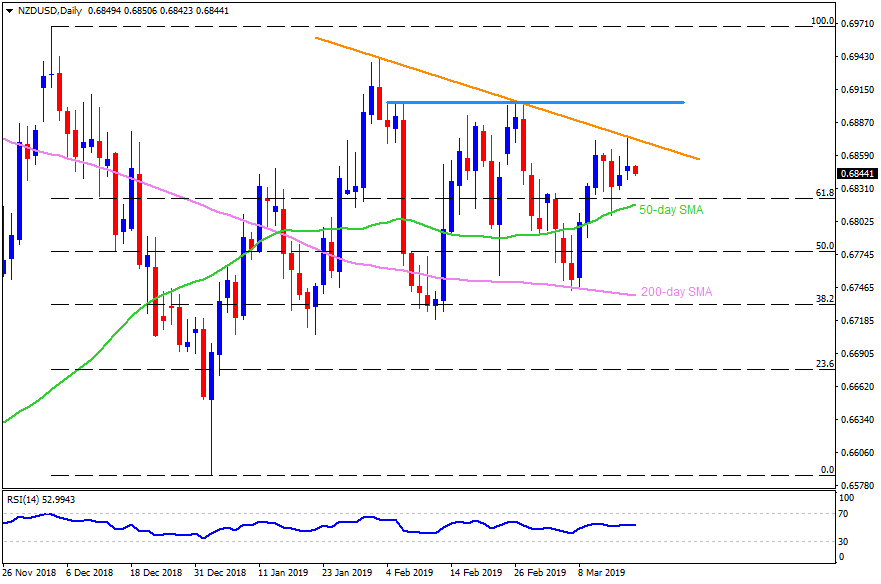
NZD/USD daily chart
- NZD/USD trades near 0.6845 during early Asian sessions on Tuesday.
- The pair recently reversed from seven-week-old descending trend-line, which in-turn portrays brighter chances of its pullback to 50-day simple moving average (SMA) figure around 0.6815.
- Should the quote drops beneath 0.6815, 0.6790 and 50% Fibonacci retracement level of 0.6770 can entertain sellers ahead of pleasing them with 200-day SMA level of 0.6740.
- On the contrary, an upside clearance of 0.6880 resistance-line could trigger pair’s rise to 0.6905-10 horizontal area including multiple highs marked since February 04.
- Assuming pair’s successful advance past-0.6910, 0.6945 and 0.6970 may flash on Bulls’ radar.
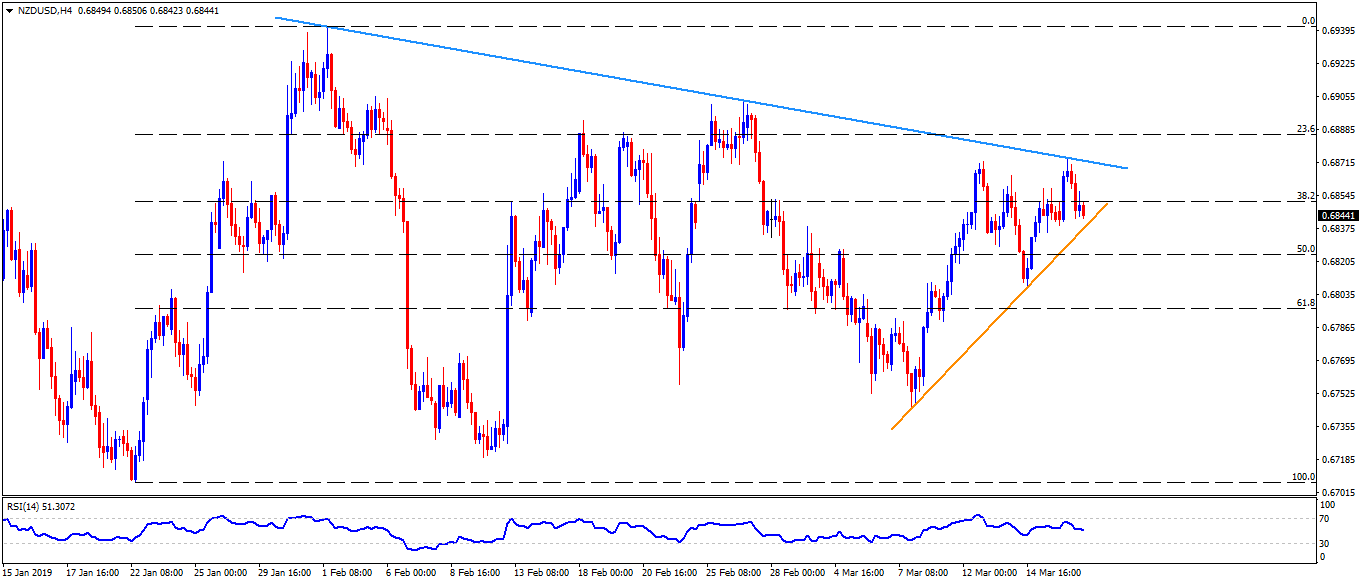
NZD/USD 4-Hour chart
- An immediate upward sloping support-line since March 07, at 0.6835, can restrict nearby declines.
- 0.6925 may act as an intermediate halt between 0.6910 and 0.6940.
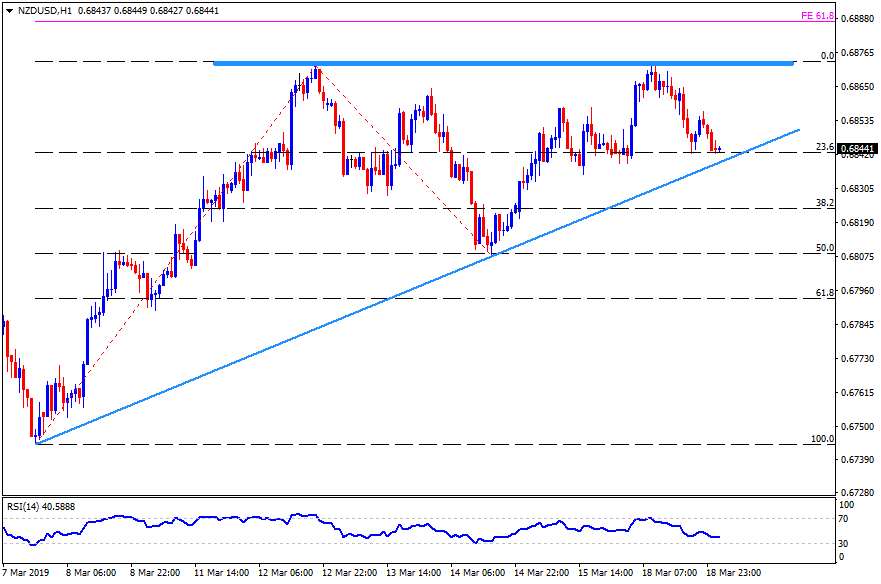
NZD/USD hourly chart
- 50% Fibonacci retracement may act as a buffer near 0.6800 round-figure if the quote declines below 0.6815 and aims for 0.6790.
- Also, 0.6860 could become adjacent resistance to watch.