After reaching new peaks, the kiwi retreated. The upcoming week features the RBNZ Financial Stability Report and Retail Sales among other events. Here is an outlook for these events, and an updated technical analysis for NZD/USD.
Employment figures came out better than expected in the past week, cushioning the fall of the kwi as the dollar stormed, also due to good US job figures. The government in New Zealand will change taxing and introduce regulatory changes to lure global fund managers and foreign investors to create economic activity and boost New Zealand’s economy. Will this move succeed?
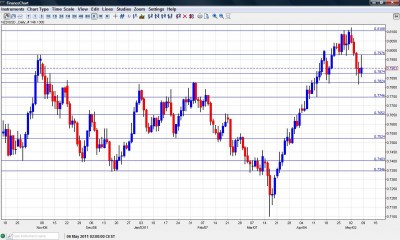
NZD/USD daily chart with support and resistance lines on it. Click to enlarge:
-
REINZ HPI: Tuesday. The house price index climbed by 0.5% in March following 2.3% rise in February. The increase was led by a growing number of assets sold amounting to 5848 in March from 4502 in February. A smaller gain is expected now.
-
RBNZ Financial Stability Report: Tuesday, 22:00. RBNZ Financial Stability Report was first released by the Reserve Bank in October 2004. a six-monthly report covering inflation, employment, growth and more influenced the kiwi. It is expected to be negative this time following the earthquake in Christchurch.
-
Business NZ Manufacturing Index: Wednesday, 23:30. New Zealand manufacturing sector slowed for the second month reaching 50.1 in March from 52.6 in February as a result of February’s Christchurch earthquake. It is believed that the Index will strengthen in the coming months. The same figure is expected now.
-
FPI: Wednesday, 23:45. New Zealand food price Index climbed further in March by 0.3% following 0.1% gain in February. The increase in food prices was caused by rising fuel costs. A small decrease is predicted.
* All times are GMT.
NZD/USD Technical Analysis
The kiwi had a god beginning to the week, making another attempt to settle above the 0.81 line (discussed last week). But the US dollar stormed the board, and the pair eventually fell and bounced at the 0.7824 line before closing just above 0.79.
Technical levels from top to bottom:
The all-time high of 0.8215 is naturally the highest point. The pair didn’t get too far from it recently. The 81 line, which was also a line of resistance now and also in the previous rise, remains strong resistance.
The previous post crisis high of 0.7975 remains an important line, remaining very distinctive, separating ranges. This was clearly seen now. 0.7875, which was support in 2010, is a weak line now.
0.7825 is important support after capping the pair at the beginning of the year, and working as support twice in the past month. This might be tested on a fresh dollar storm.
0.7746 worked as support in November and as resistance in January and is minor support now. Stronger support is found at the 0.7655 peak seen in February.
0.7523 is a veteran resistance line, that worked as strong support in January and remains important. 0.74 was a line of support twice in during the fall and is the next line. The last line for now is the December trough of 0.7350.
I am neutral on NZD/USD.
While the kiwi is backed by a recovering economy, the drop in commodity prices poses a threat and balances the picture.
Further reading:
-
For a broad view of all the week’s major events worldwide, read the USD outlook.
-
For EUR/USD, check out the Euro/Dollar forecast.
-
For the Japanese yen, read the USD/JPY forecast.
-
For GBP/USD (cable), look into the British Pound forecast.
-
For the Australian dollar (Aussie), check out the AUD to USD forecast.
-
For USD/CAD (loonie), check out the Canadian dollar.
