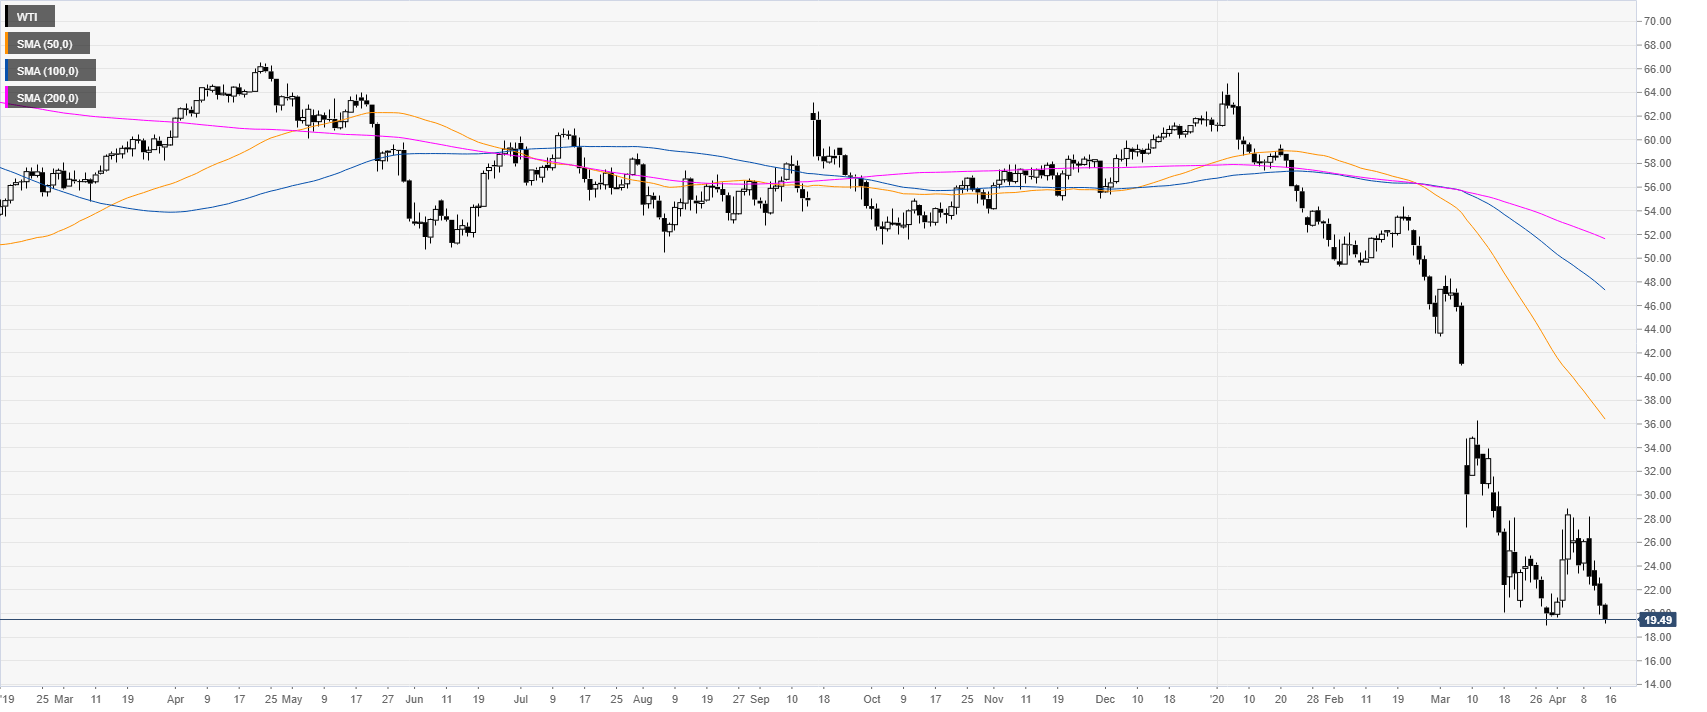
- WTI bear trend remains intact as the market is about to challenge the 2020 lows.
- The level to beat for bears is the 19.02 support.
WTI daily chart
WTI is under heavy pressure trading near multi-year lows as crude oil is at a stone’s throw from the 2020 low at the 19.02 level.
WTI four-hour chart
WTI is trading below its main SMAs on the four-hour chart suggesting a bearish bias in the medium term. As this market remains under heavy selling pressure, the 2020 low is probably going to be challenged and a daily close below the 19.02 level could lead to further downside towards the 18.00, 16.15 and 13.30 price levels. On the flip side, retracements up can find resistance near the 22.00 and 24.00 price level near the 50 SMA.
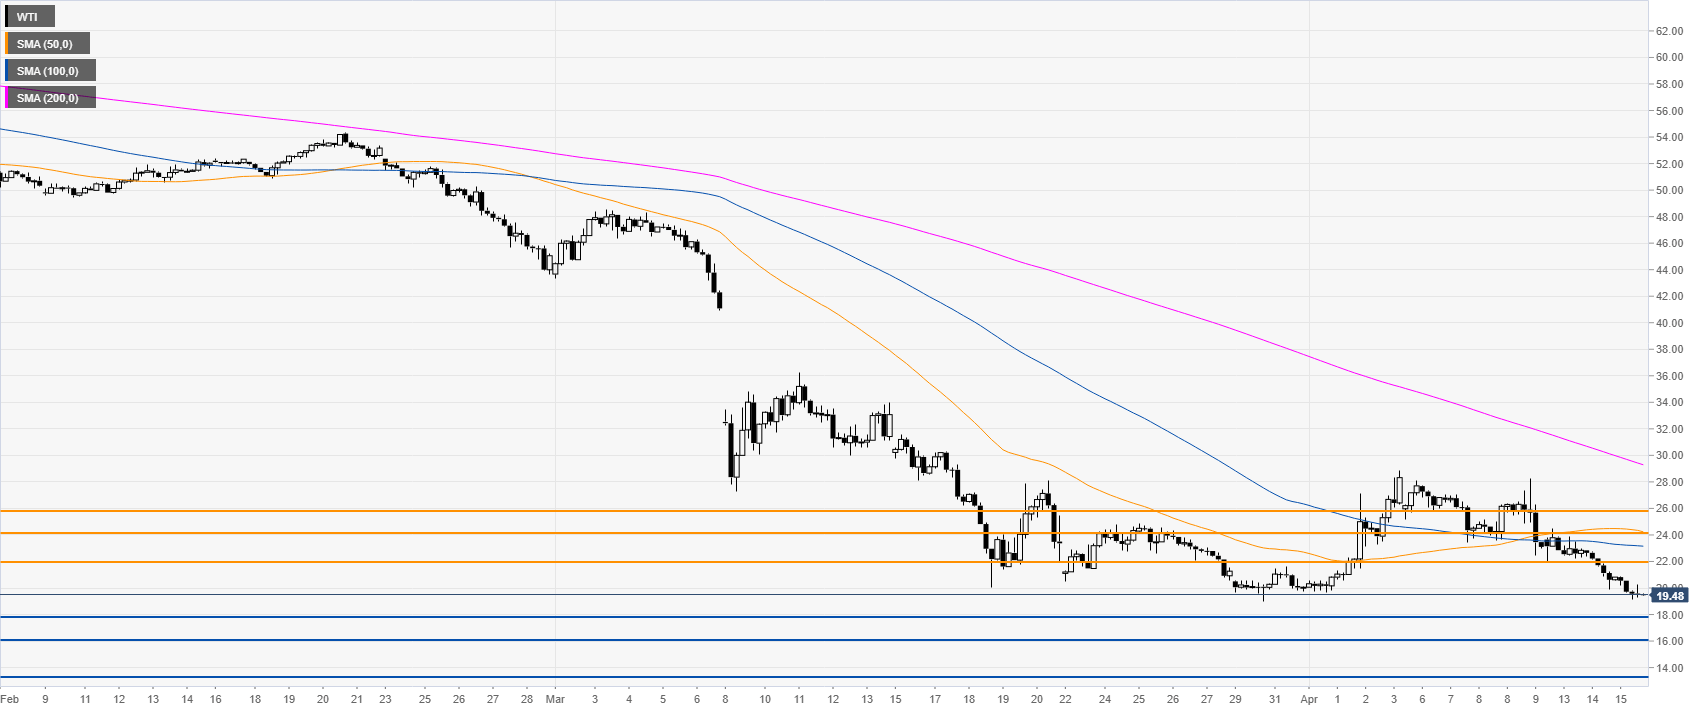
Additional key levels
