- WTI’s is consolidating in a descending triangle, according to the hourly chart.
- A breakout, if confirmed, would imply a continuation of the recent rally.
West Texas Intermediate’s front-month contract is trading near $32 at press time. The black gold has been largely restricted to a narrow range of $31 to $33 since Monday.
The consolidation has taken the shape of a descending triangle on the hourly chart. A move above the triangle resistance at $32.20 would confirm the descending triangle breakout and signal a continuation of the rally from lows below $27 observed on May 14. The immediate resistance is located at $33.10.
However, a bearish reversal would be confirmed if prices break below $31.24, confirming a triangle breakdown. That could cause more buyers to take profits, leading to a deeper decline to levels below $30.
With prices currently stuck in the triangle pattern, the immediate outlook is neutral. However, the broader outlook looks constructive with the 50-, 100- and 200-hour averages trending north and stacked one above the other.
Hourly chart
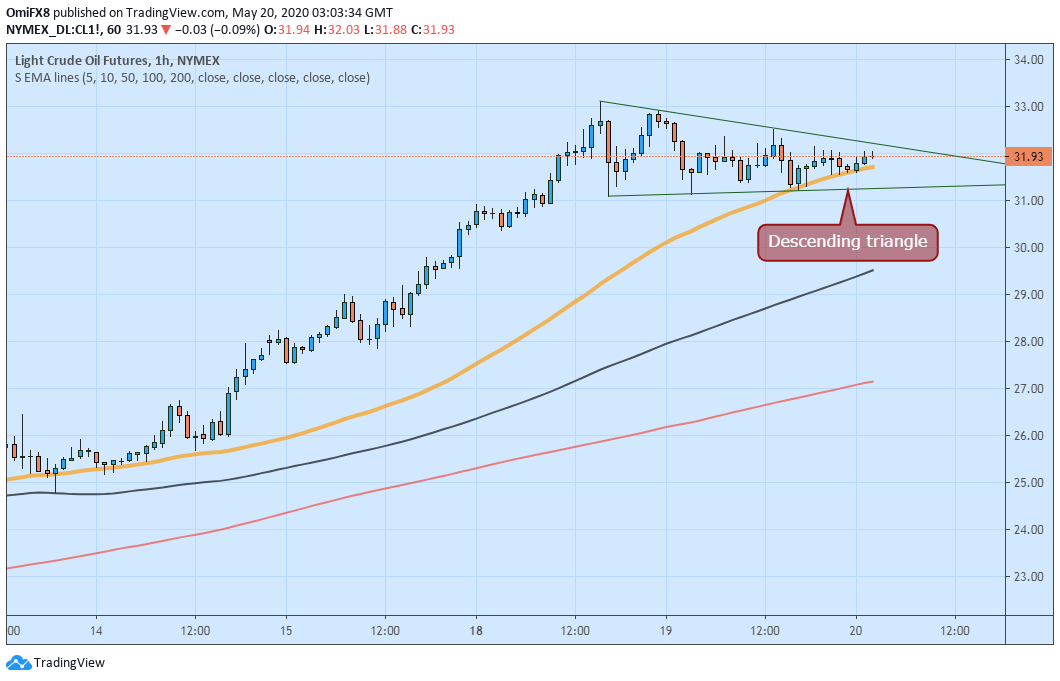
Trend: Neutral
Technical levels
