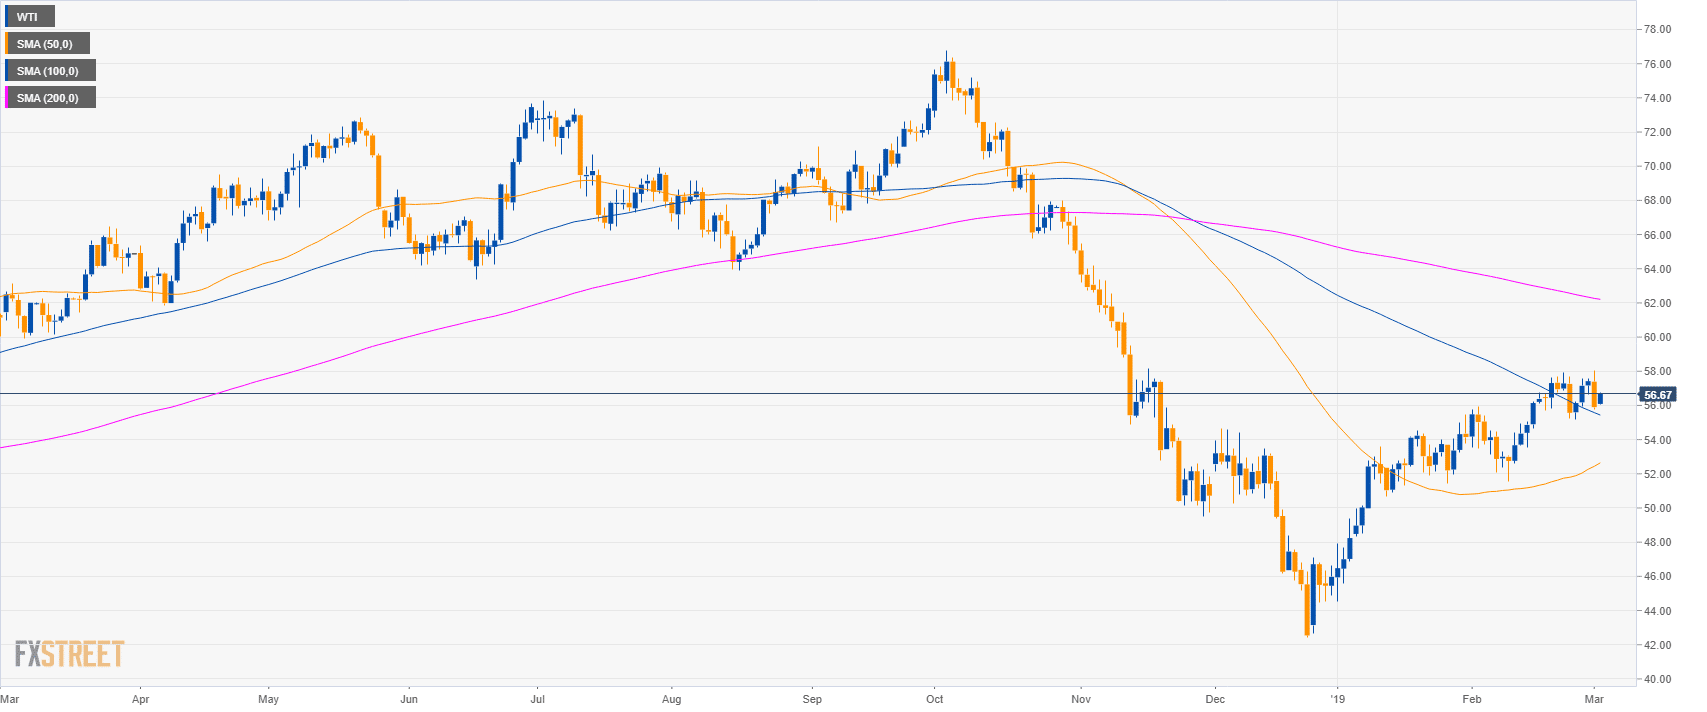
Oil daily chart
- Oil is trading above the 50 and 100-day simple moving averages (SMAs) suggesting a mild bullish bias.
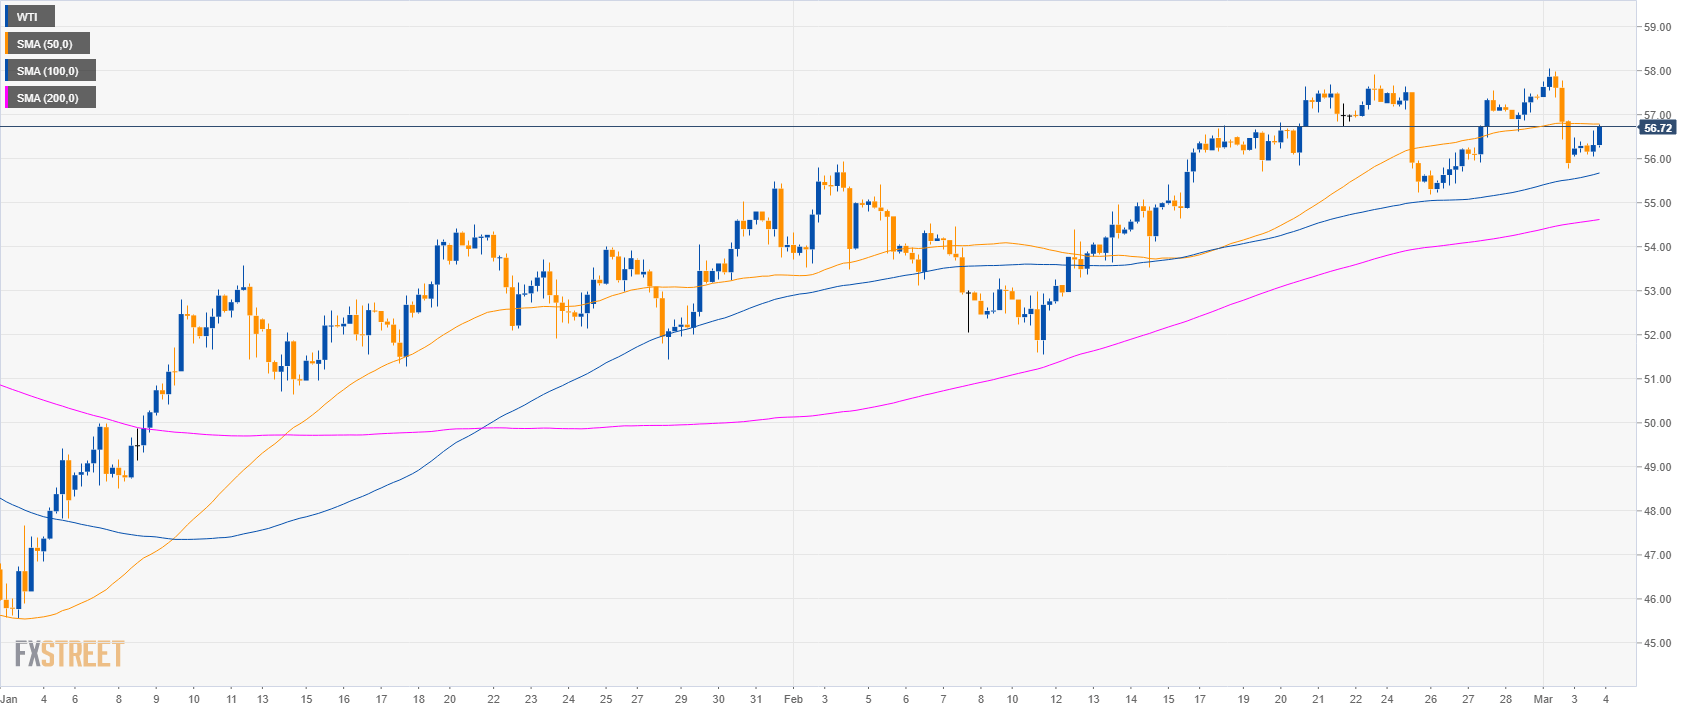
Oil 4-hour chart
- Oil is trading above the 100 and 200-day simple moving averages (SMAs) suggesting a bullish bias in the medium-term.
- Bulls are testing the 50 SMA.
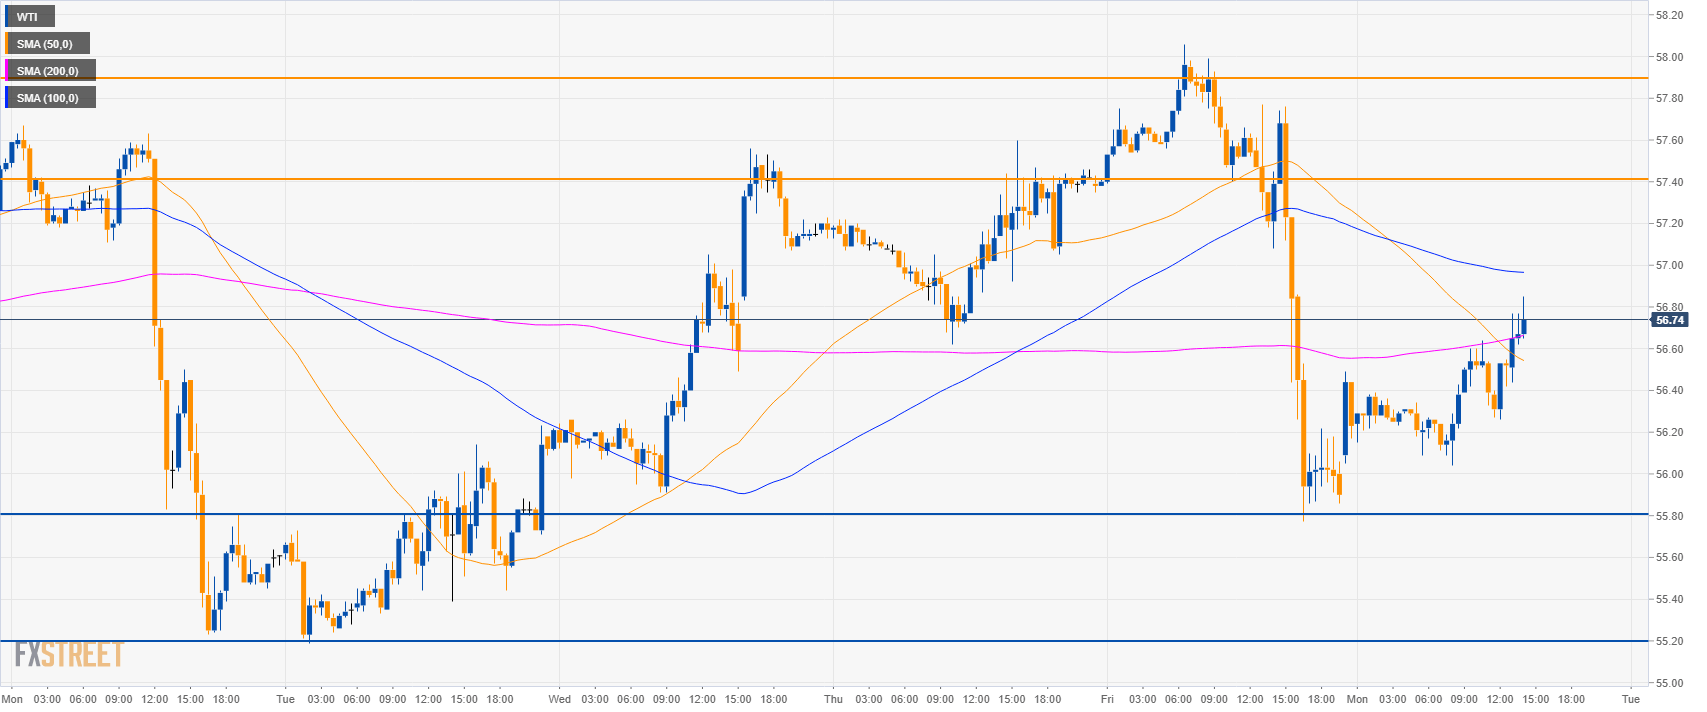
Oil 30-minute chart
- Bulls are breaking above the 200 SMA suggesting bullish momentum.
- Resistances to the upside are at 57.40 and 57.90 level.
- Support is at 55.80 and 55.20 level.
Additional key levels
GBP/USD
Overview:
Today Last Price: 1.321
Today Daily change %: 0.05%
Today Daily Open: 1.3203
Trends:
Daily SMA20: 1.3019
Daily SMA50: 1.2927
Daily SMA100: 1.2882
Daily SMA200: 1.2991
Levels:
Previous Daily High: 1.3287
Previous Daily Low: 1.3171
Previous Weekly High: 1.3351
Previous Weekly Low: 1.3051
Previous Monthly High: 1.3351
Previous Monthly Low: 1.2773
Daily Fibonacci 38.2%: 1.3215
Daily Fibonacci 61.8%: 1.3242
Daily Pivot Point S1: 1.3154
Daily Pivot Point S2: 1.3105
Daily Pivot Point S3: 1.3038
Daily Pivot Point R1: 1.3269
Daily Pivot Point R2: 1.3336
Daily Pivot Point R3: 1.3385
