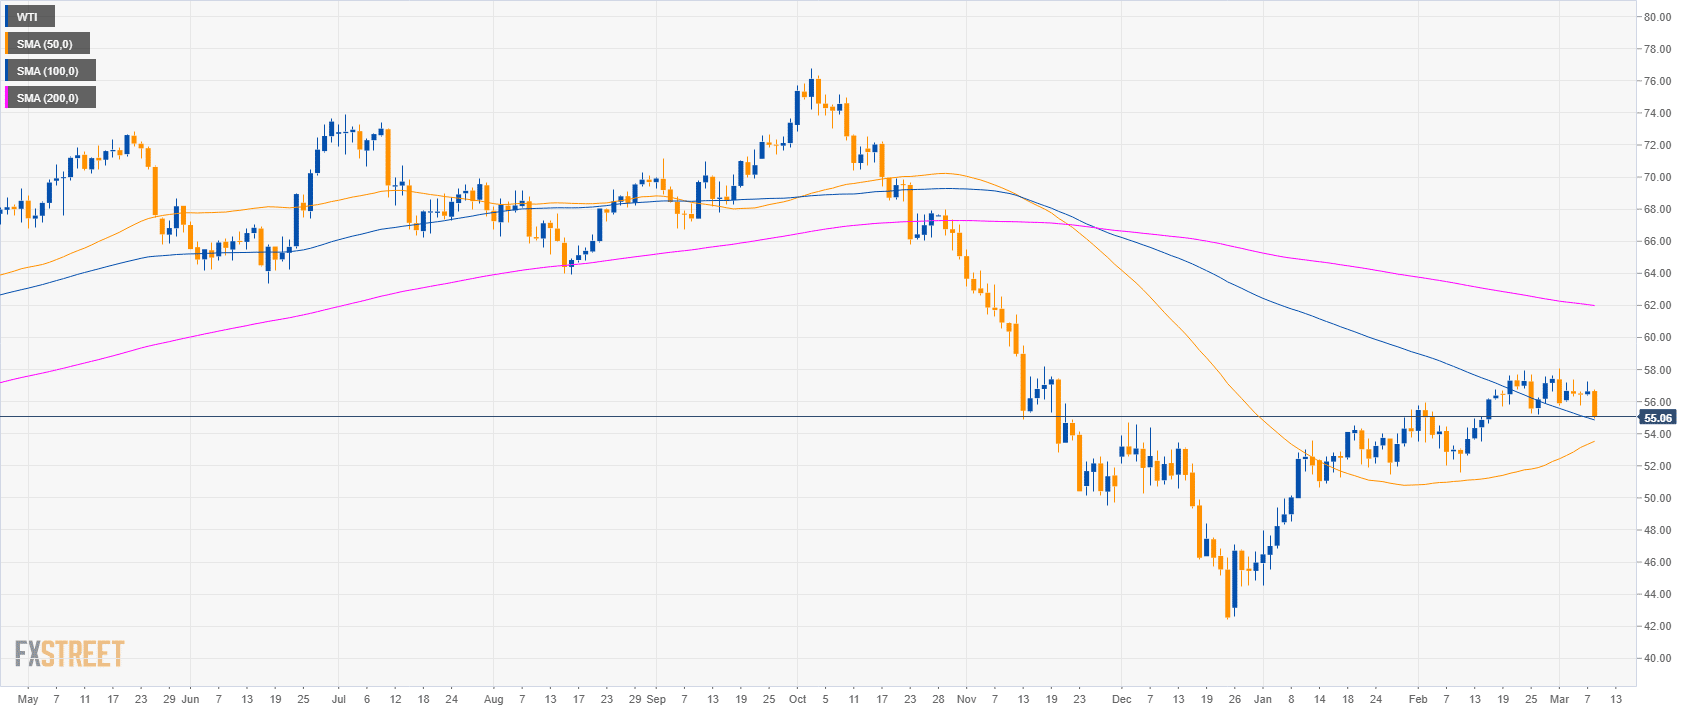
Oil daily chart
- Oil is trading above the 50 and 100-day simple moving averages (SMAs) suggesting a mild bullish bias.
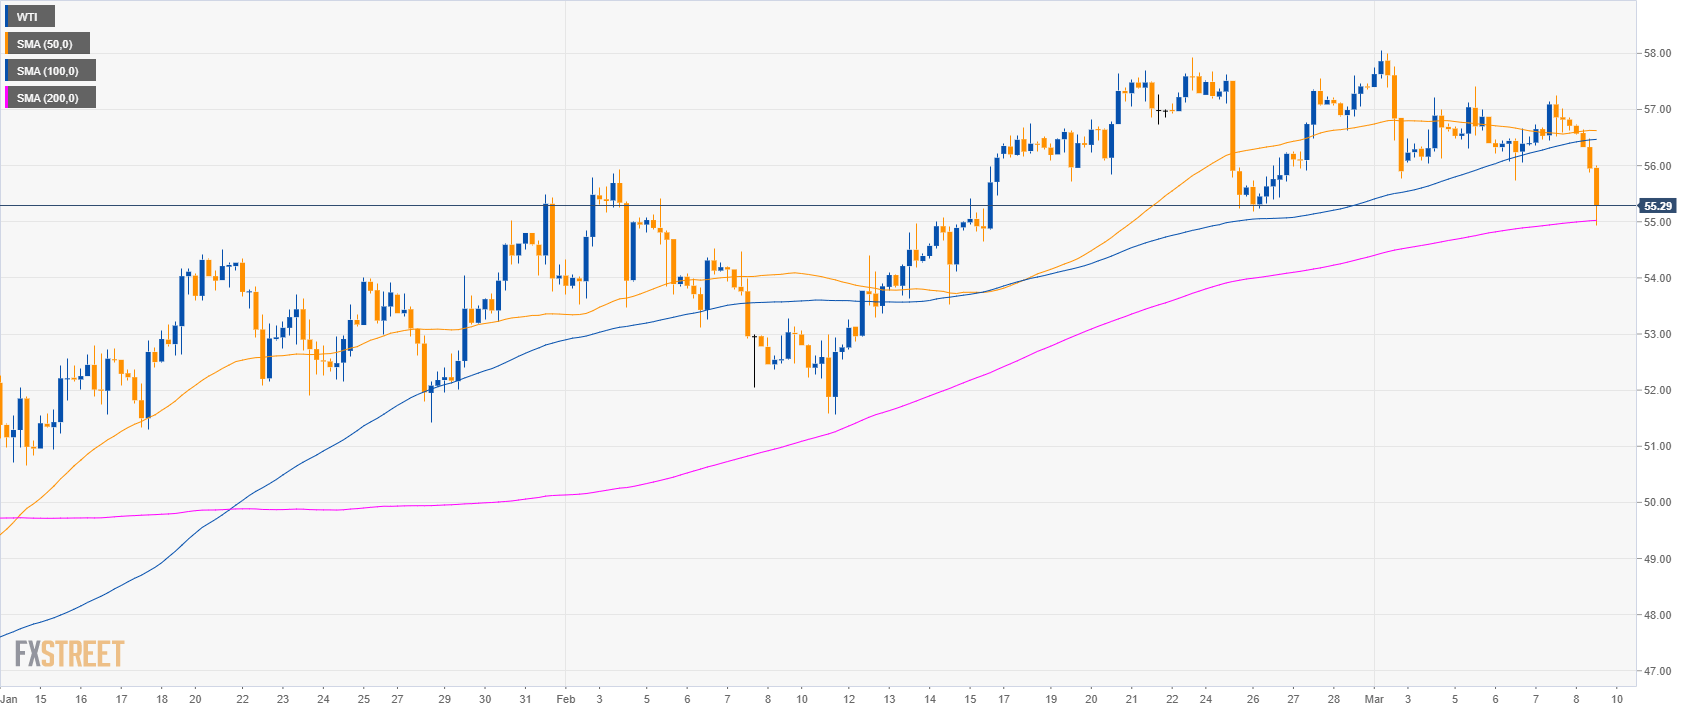
Oil 4-hour chart
- Crude oil WTI is testing the 200 SMA.
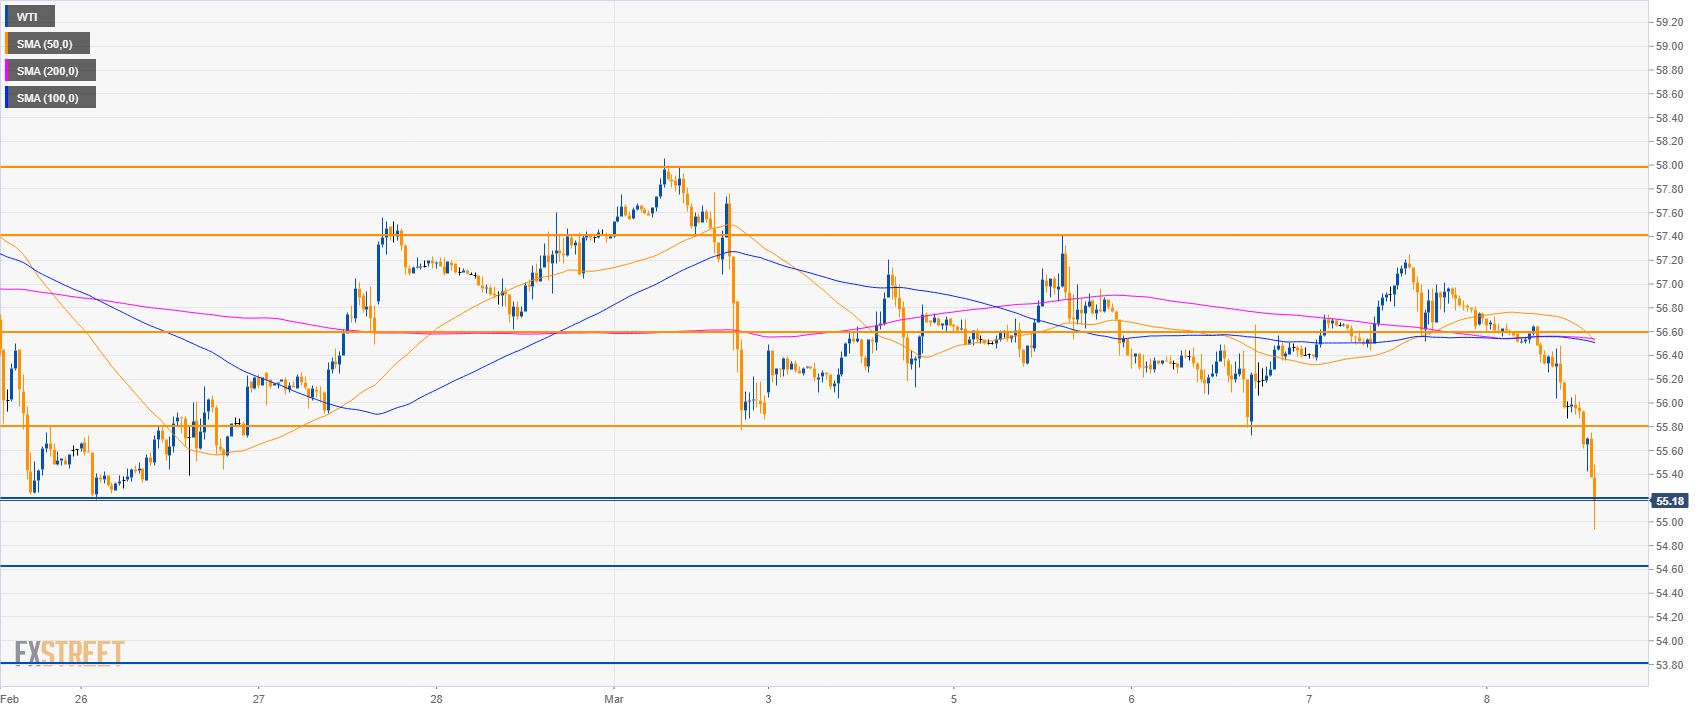
Oil 30-minute chart
- Oil is trading below its main SMAs suggesting bearish momentum in the near-term.
- Bears are breaking below 55.20 and the next supports are seen at 54.60 and 53.80 level.
- To the upside, resistances are at 55.80 and 56.60 level.
Additional key levels
WTI
Overview:
Today Last Price: 55.08
Today Daily change: -156 ticks
Today Daily change %: -2.75%
Today Daily Open: 56.64
Trends:
Daily SMA20: 55.88
Daily SMA50: 53.47
Daily SMA100: 54.09
Daily SMA200: 61.97
Levels:
Previous Daily High: 57.25
Previous Daily Low: 56.36
Previous Weekly High: 58.06
Previous Weekly Low: 55.19
Previous Monthly High: 57.92
Previous Monthly Low: 51.56
Daily Fibonacci 38.2%: 56.91
Daily Fibonacci 61.8%: 56.7
Daily Pivot Point S1: 56.25
Daily Pivot Point S2: 55.86
Daily Pivot Point S3: 55.36
Daily Pivot Point R1: 57.14
Daily Pivot Point R2: 57.64
Daily Pivot Point R3: 58.03
