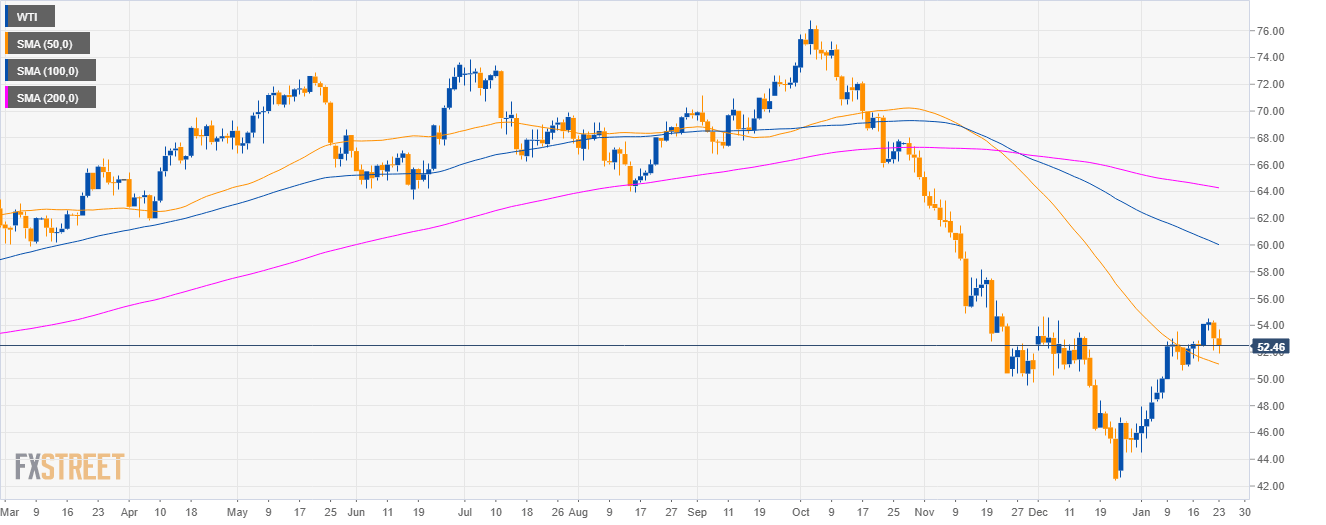
Oil daily chart
- Crude oil WTI is in a bear trend below the 100 and 200-day simple moving averages (SMAs).
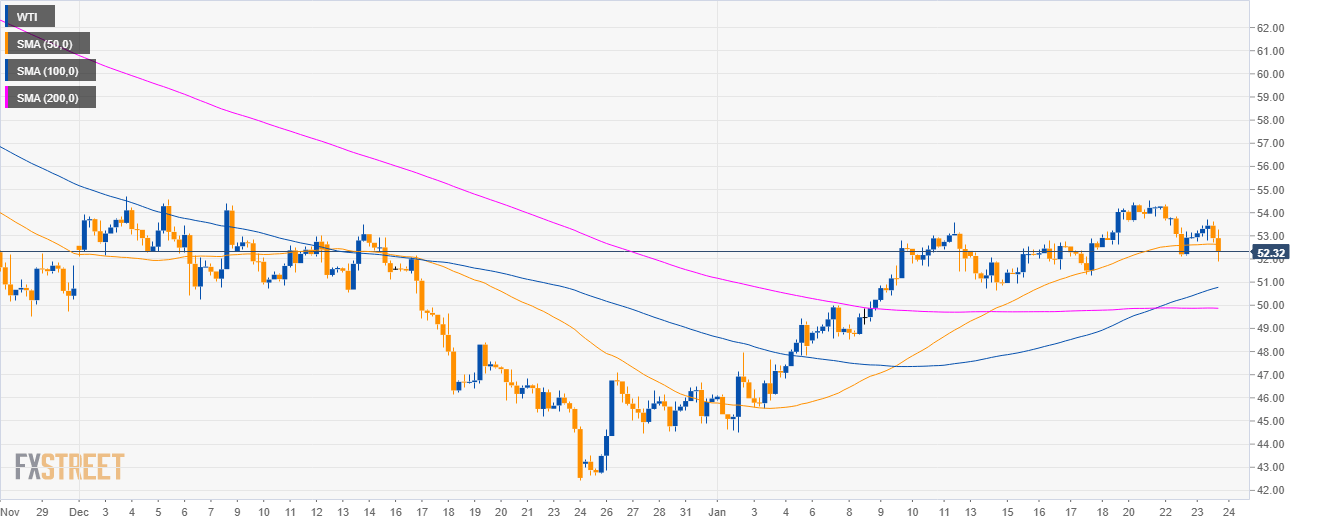
Oil 4-hour chart
- The market is testing the 52.00 figure along with the 50 SMA.
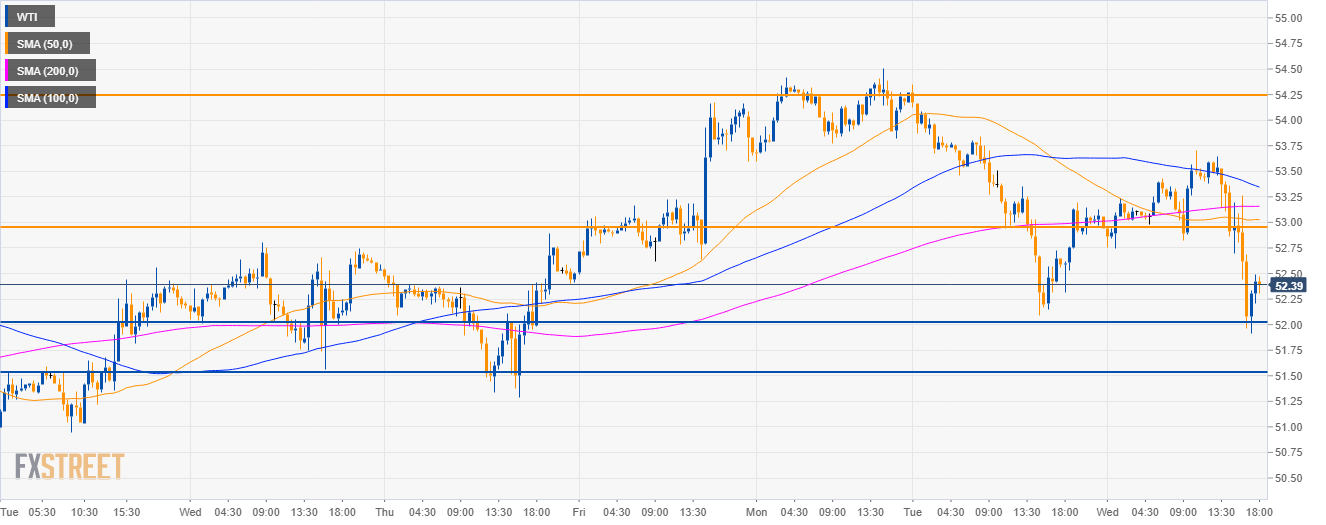
Oil 30-minute chart
- Bulls will try to recapture the 53.00 figure as they are finding support at the 52.00 level.
- Support to the downside is seen at the 51.50 level.
Additional key levels
WTI
Overview:
Today Last Price: 52.32
Today Daily change: 71 pips
Today Daily change %: -1.34%
Today Daily Open: 53.03
Trends:
Daily SMA20: 50.16
Daily SMA50: 50.8
Daily SMA100: 59.38
Daily SMA200: 63.96
Levels:
Previous Daily High: 54.35
Previous Daily Low: 52.09
Previous Weekly High: 54.17
Previous Weekly Low: 50.65
Previous Monthly High: 54.68
Previous Monthly Low: 42.45
Daily Fibonacci 38.2%: 52.95
Daily Fibonacci 61.8%: 53.49
Daily Pivot Point S1: 51.96
Daily Pivot Point S2: 50.9
Daily Pivot Point S3: 49.7
Daily Pivot Point R1: 54.22
Daily Pivot Point R2: 55.42
Daily Pivot Point R3: 56.48
