- The bull trend remains in place above $61.00 a barrel.
- Bull will need to push prices above 62.60 to be out of the woods.
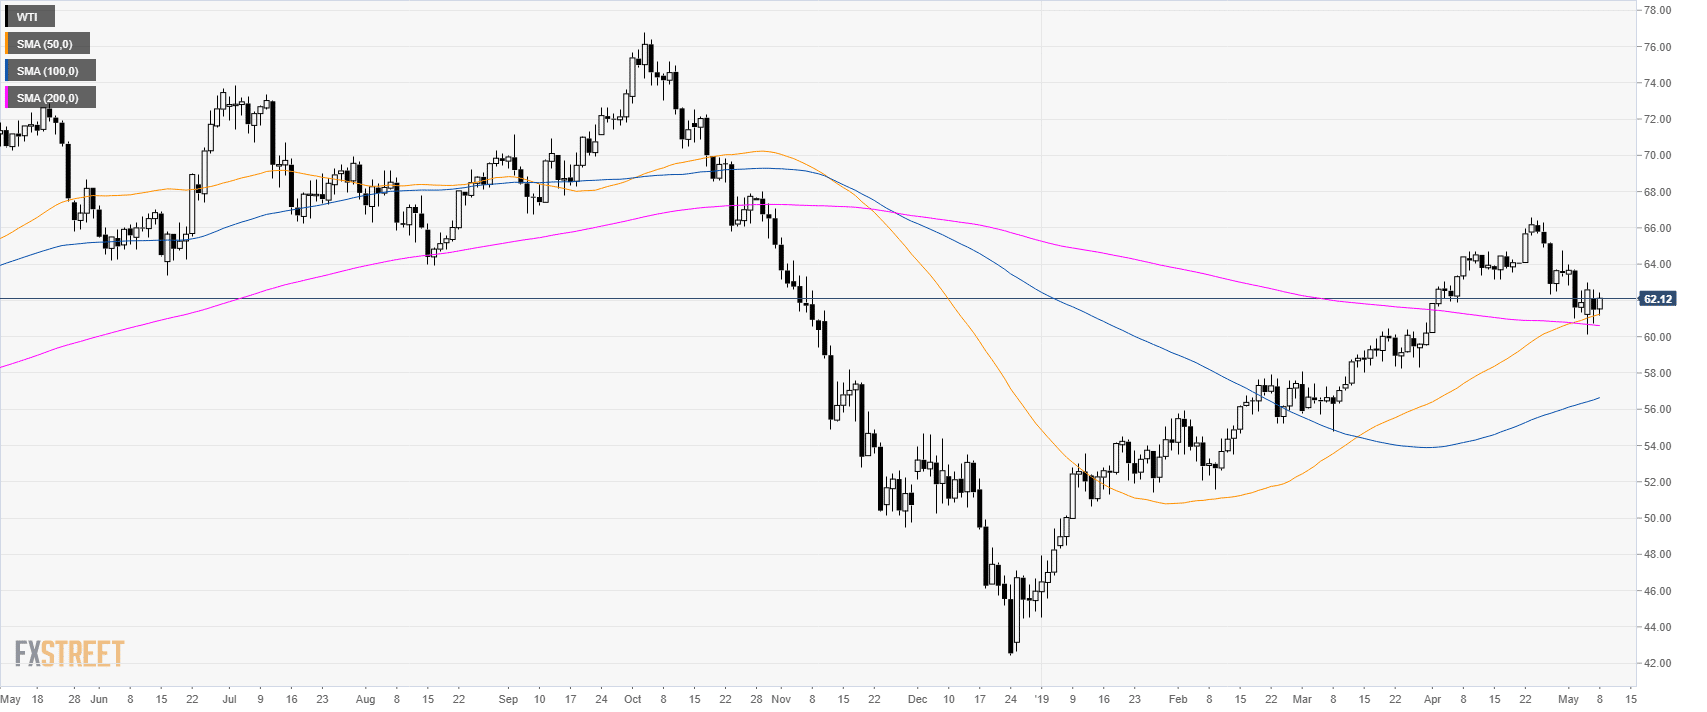
Oil daily chart
WTI (West Texas Intermediate) is trading in a bull trend above its main simple moving averages (SMAs). The market is stabilizing near $61.00 a barrel.
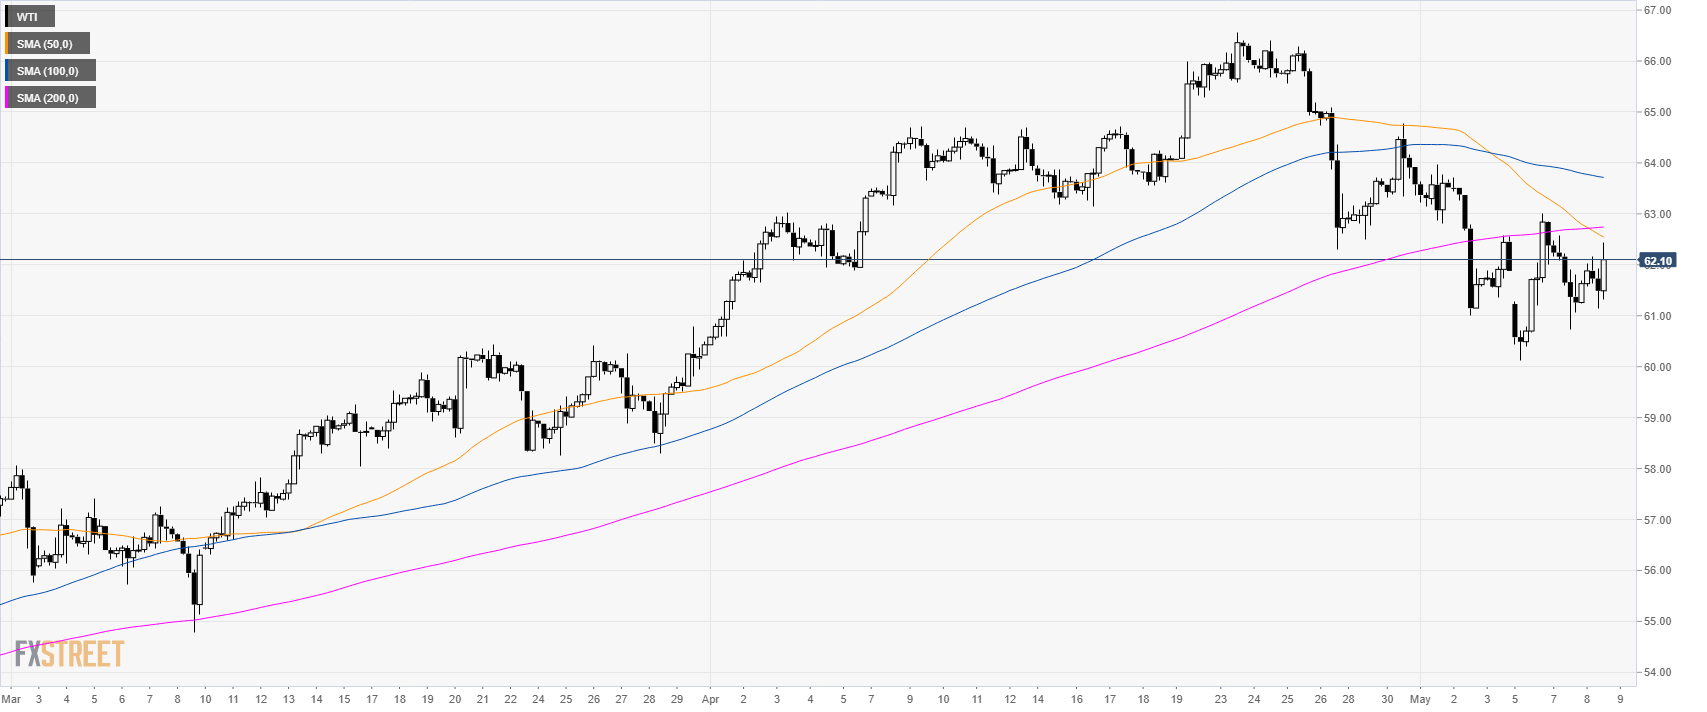
Oil 4-hour chart
WTI is trading below its main SMAs suggesting bearish pressure in the medium term.
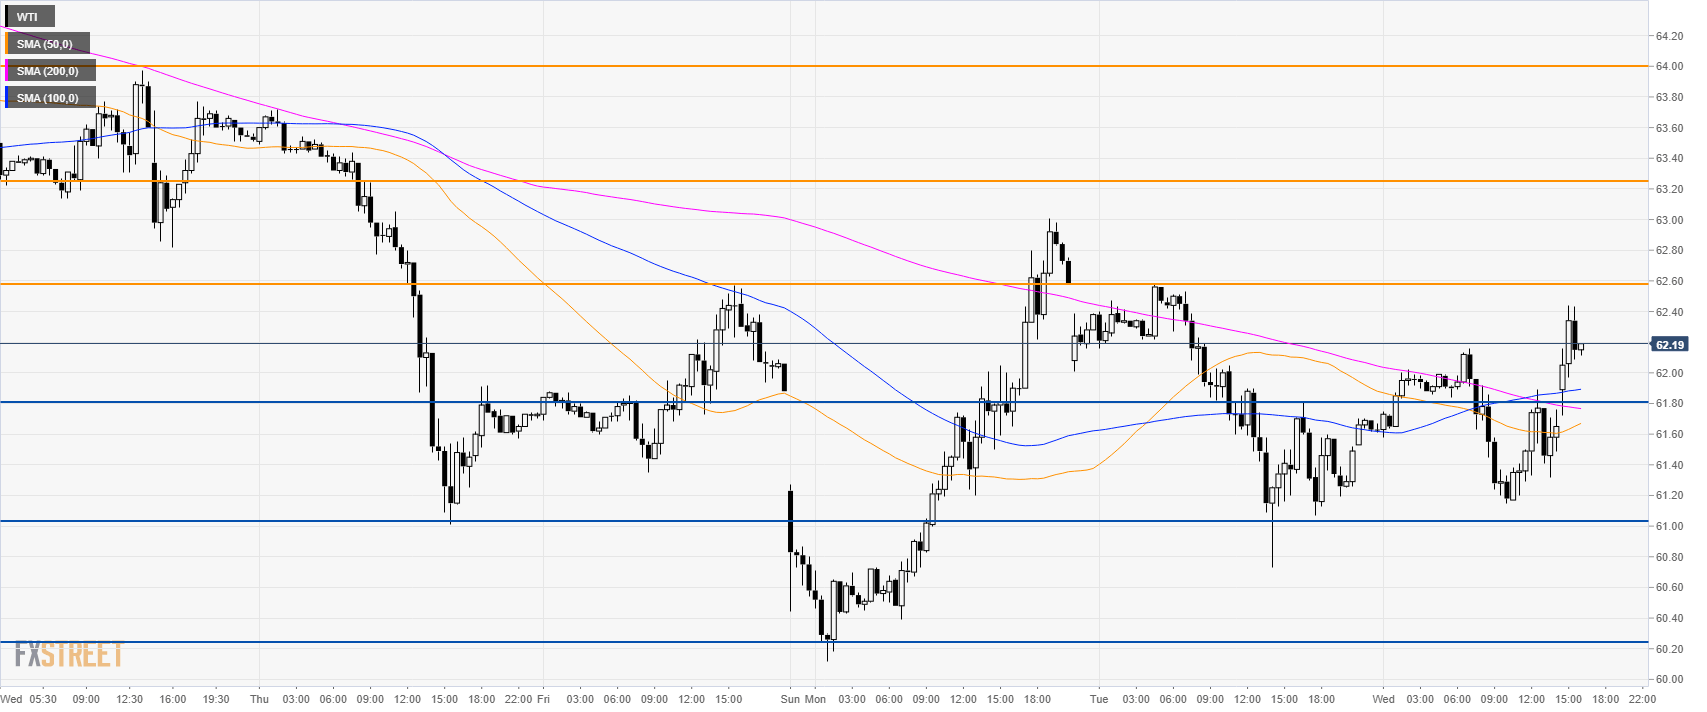
Oil 30-minute chart
WTI is trading above its main SMAs suggesting bullish momentum in the short term.
The key level to beat for bulls is 62.60. If cleared then 63.020 and 64.00 can come into play.
Supports to the downside can be seen at 61.80 and 61.00.
Additional key levels
