- The daily moving averages are now the upside targets.
- A break below the 50 handle opens the Nov 2018 lows at 49.39.
We have seen a bullish correction of the 13% bearish trend formed over the past several days of consecutive losses. The price was close to a full retracement to the year’s lows around 50.50 at its lowest level of 50.97 but the bullish pin bar played out.
WTI dropped below the 200, 50 and 21-daily moving averages as well as a break of the 78.6% Fibonacci level (a reenactment target of the August rally) within its decline.
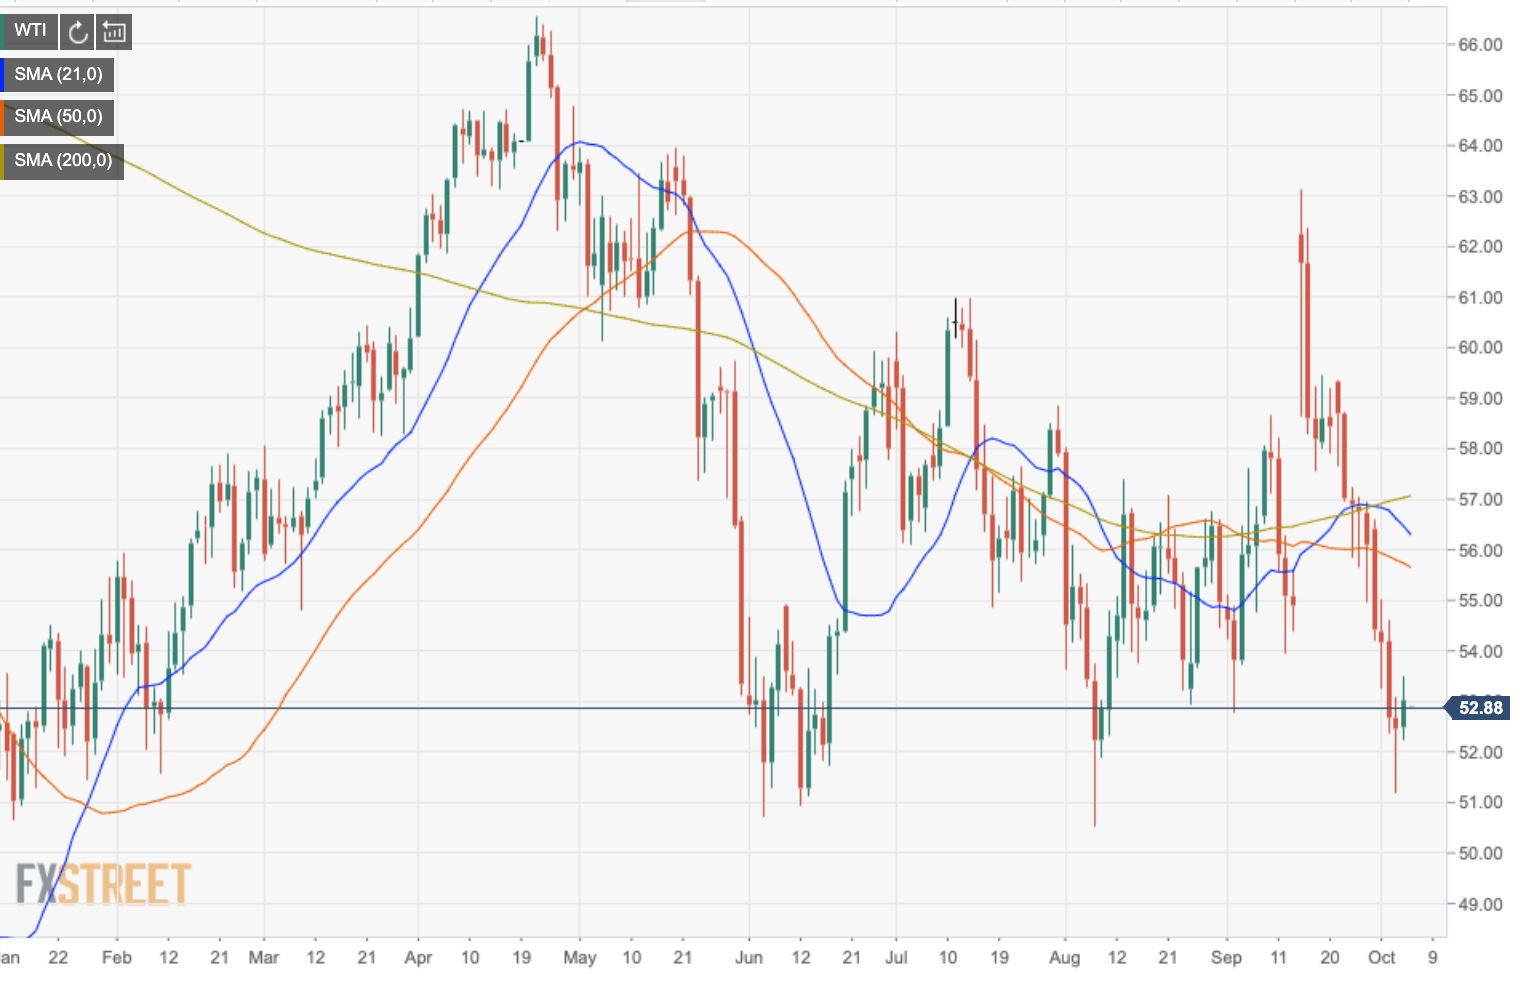
On the upside, the moving averages are now the upside targets for bulls to aim for, starting with the 21-DMA located around 55.40 while the 200-DMA resides around 56.80 – a key resistance target.
On the flip side, a break below the 50 handle opens the Nov 2018 lows at 49.39 guarding risk to the 18th Dec lows at 45.77 ahead of the dec double bottom lows below 42.50.
Daily chart