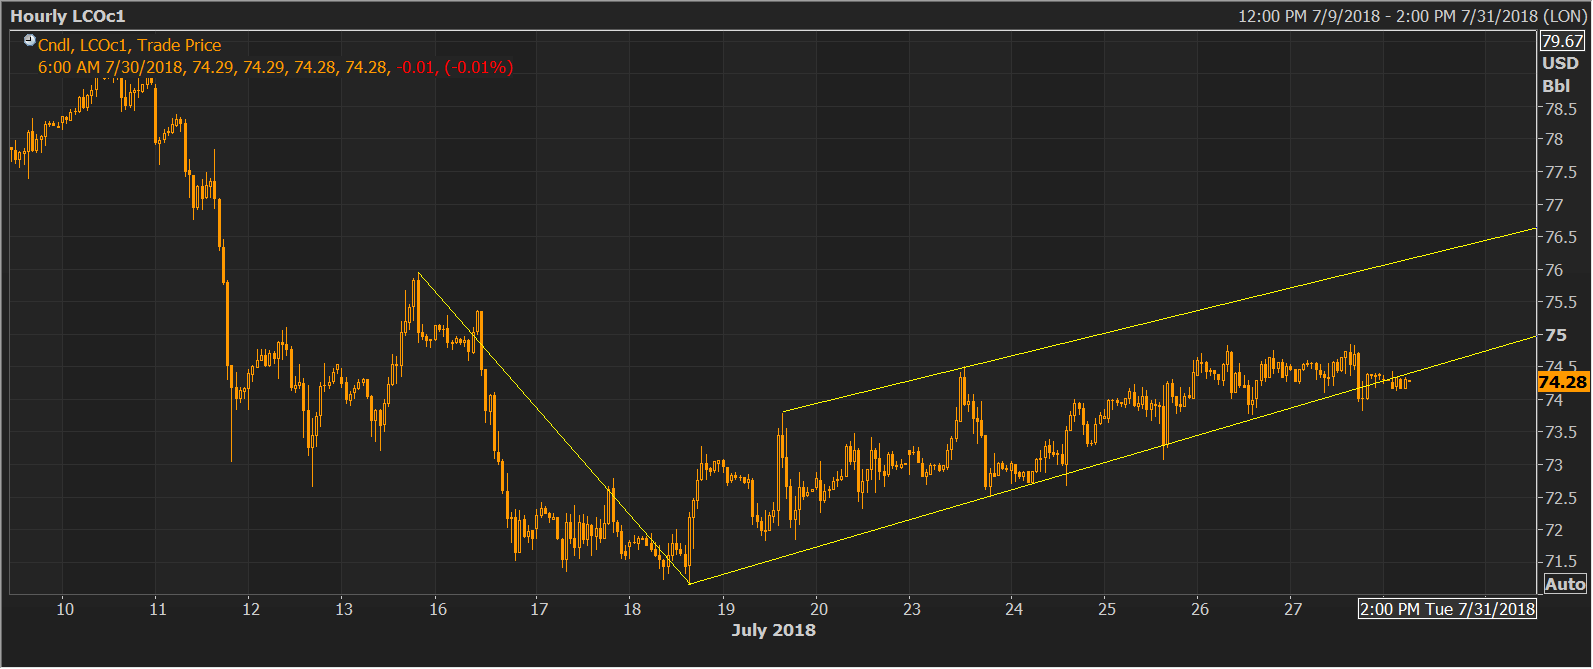
- The Brent oil hourly chart shows a bear flag pattern, meaning the corrective rally from the July 18 low of $71.21 has likely ended.
- Still, the bears are cautioned against being too ambitious as the 100-hour moving average (MA) is holding above the 200-hour MA, indicating the path of least resistance is to the upside.
Hourly chart
Current Price: $74.26
Daily High: $74.38
Daily Low: $74.16
Trend: Cautiously bearish
R1: $74.38 (resistance on the hourly chart)
R2: $74.83 (July 27 high resistance)
R3: $75.00 (psychological hurdle)
Support
S1: $74.11 (support on the hourly chart)
S2: $73.96 (100-day MA)
S3: $73.27 (200-hour MA)
