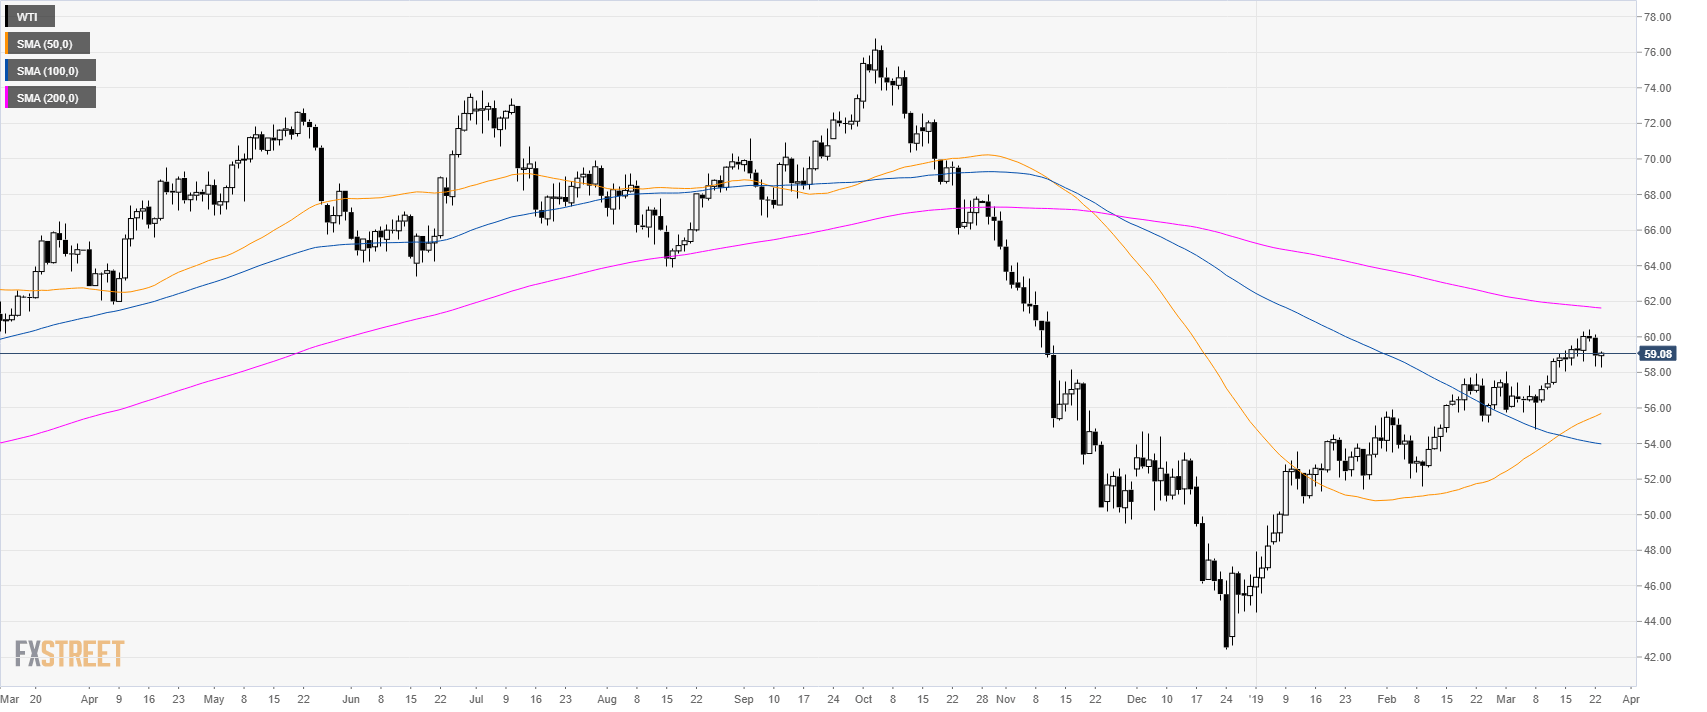
Oil daily chart
- Oil is trading above the 50 and 100-day simple moving averages (SMAs) suggesting a bullish bias.
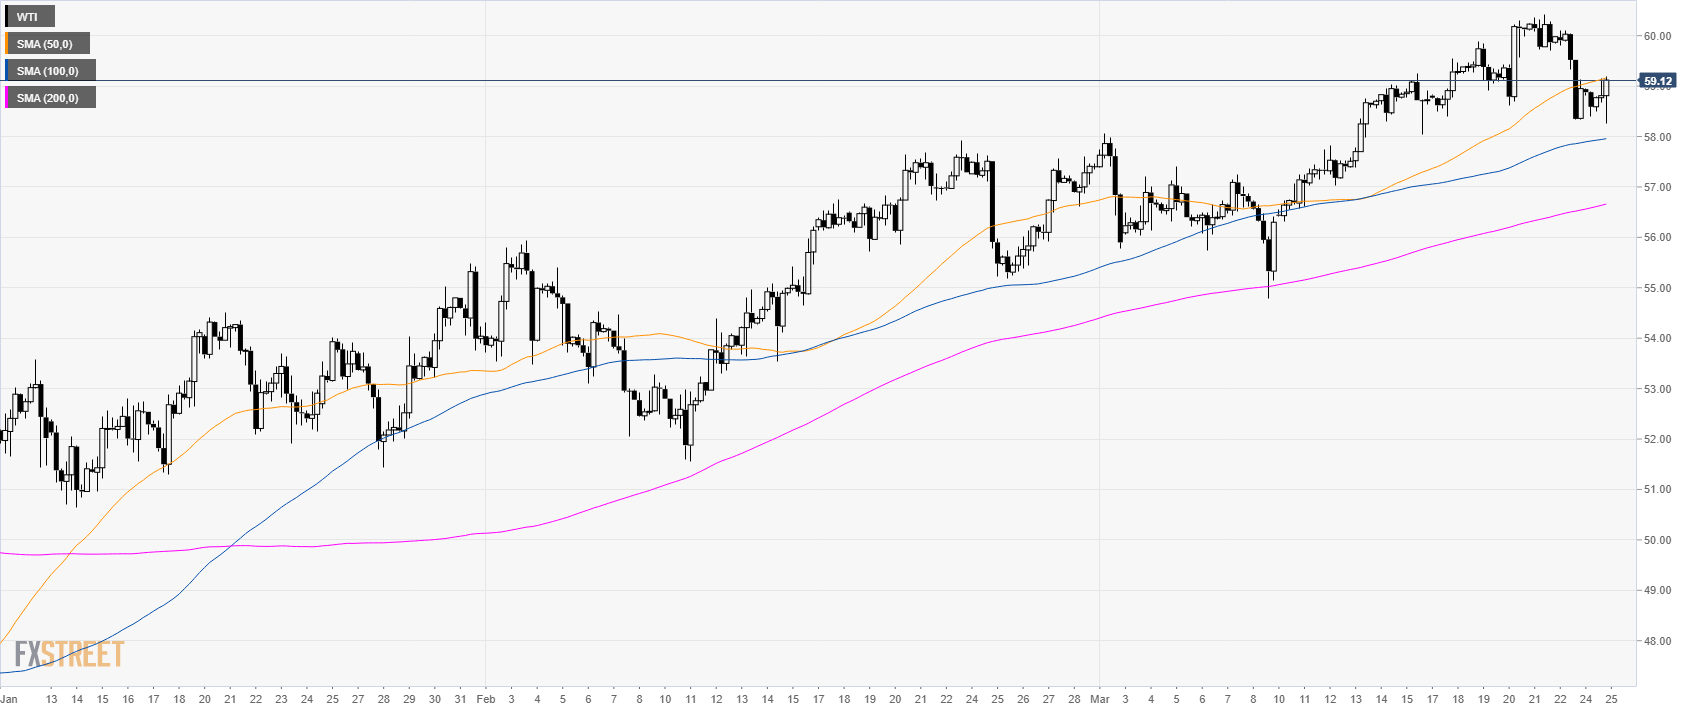
Oil 4-hour chart
- Crude oil WTI is trading above the 100 and 200 SMAs suggesting a bullish bias in the medium-term.
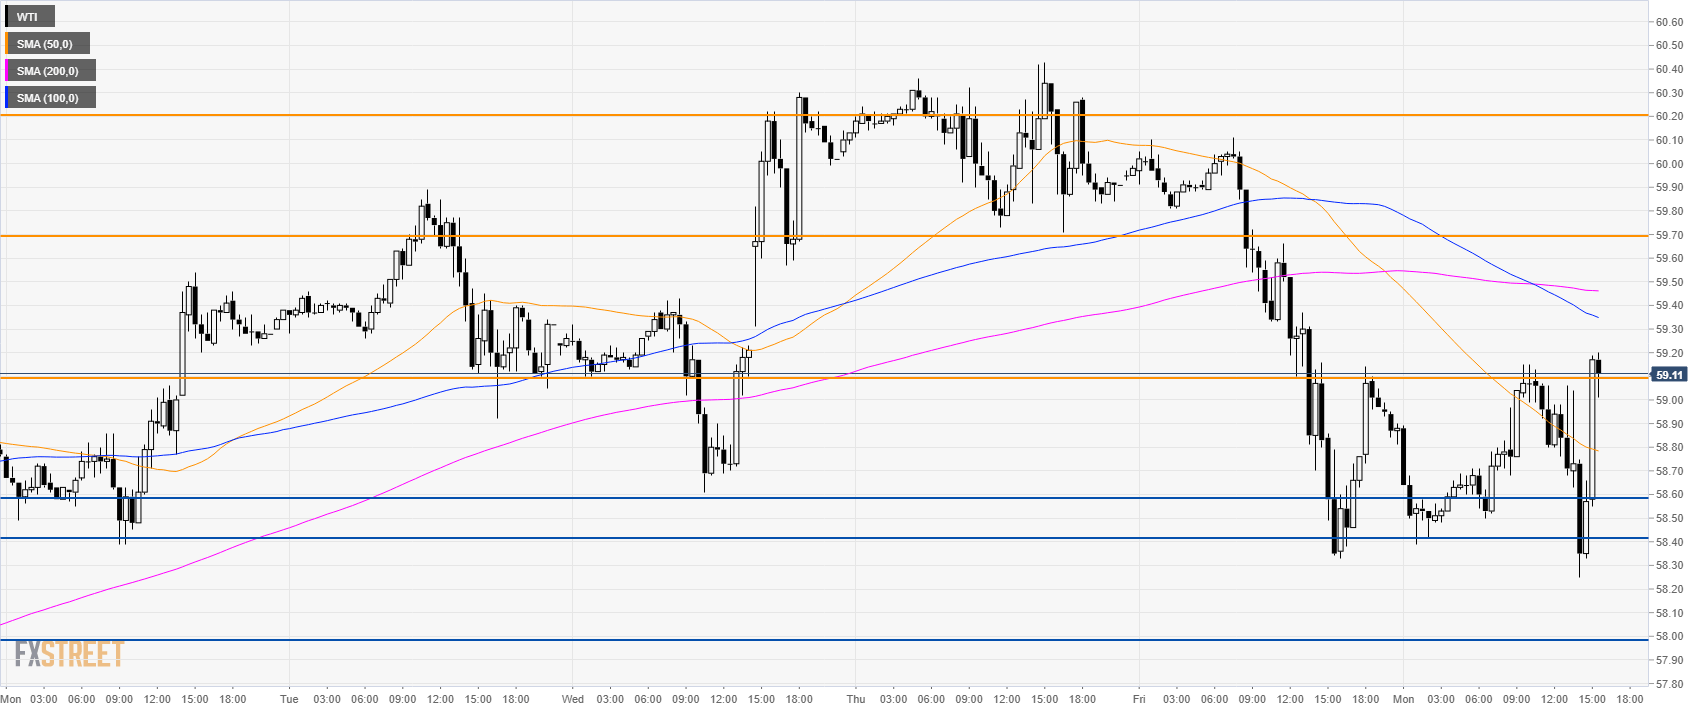
Oil 30-minute chart
- Bulls are looking for a break above 59.10. The next resistances are seen at 59.70 and 60.20 level.
- Support is at 58.60, 58.40 and 58.00 level.
Additional key levels
