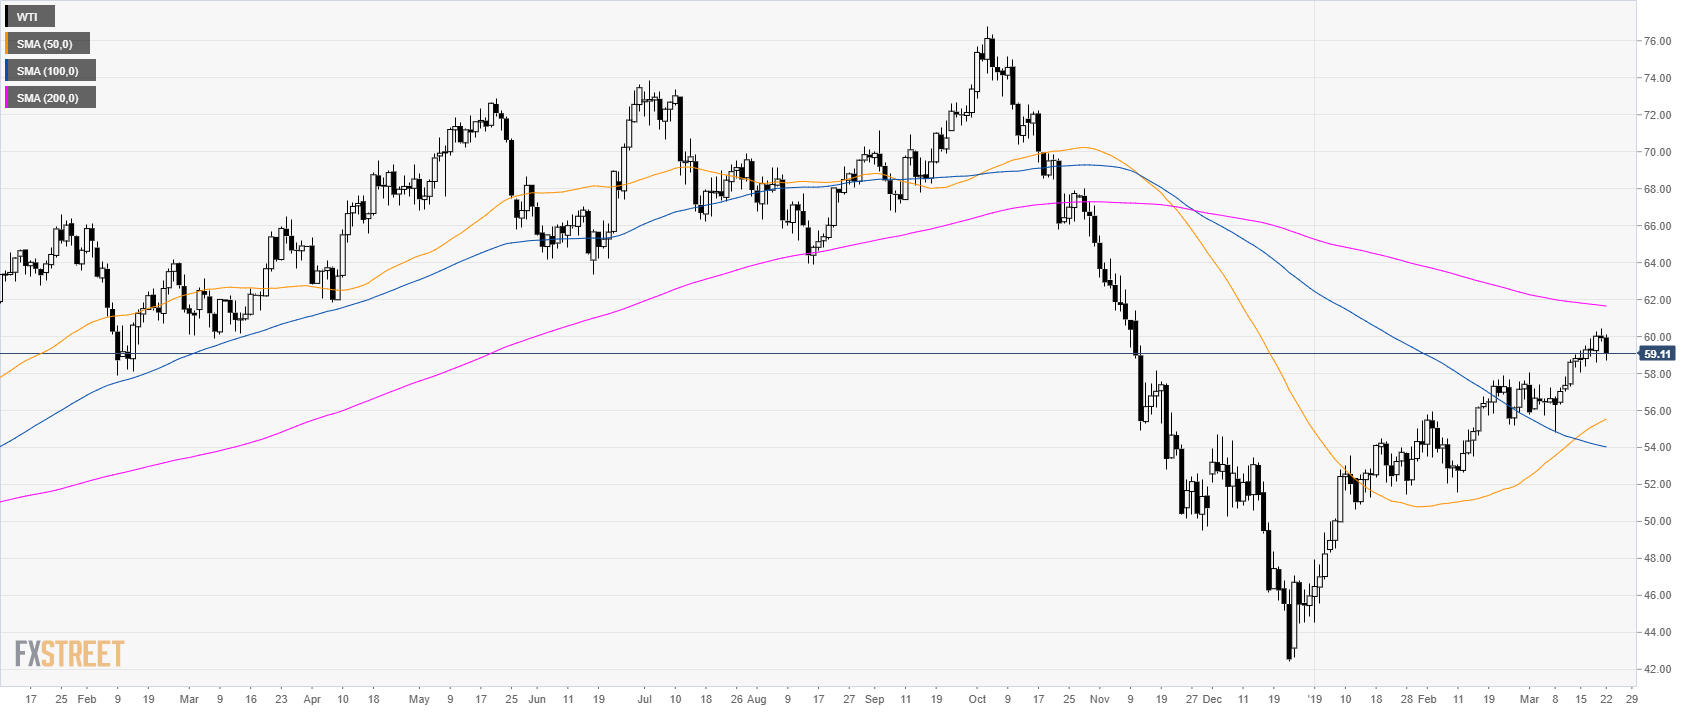
Home Oil Technical Analysis: WTI at daily lows near $59.00 a barrel
FXStreet News

Oil Technical Analysis: WTI at daily lows near $59.00 a barrel

Oil daily chart

  • Oil is trading above the 50 and 100-day simple moving averages (SMAs) suggesting a bullish bias.
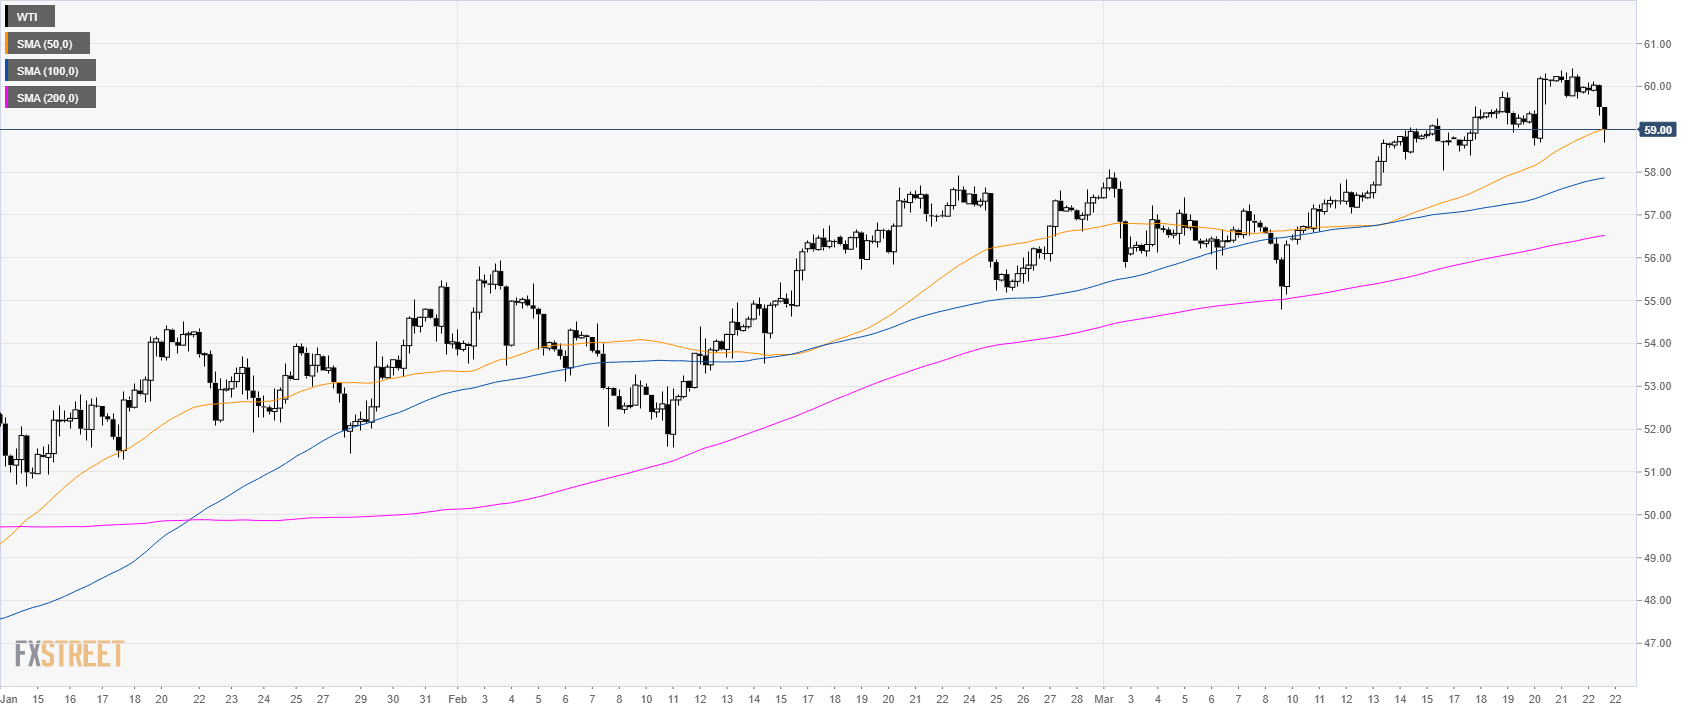

Oil 4-hour chart

  • Crude oil WTI is trading above its main SMAs suggesting a bullish bias in the medium-term.
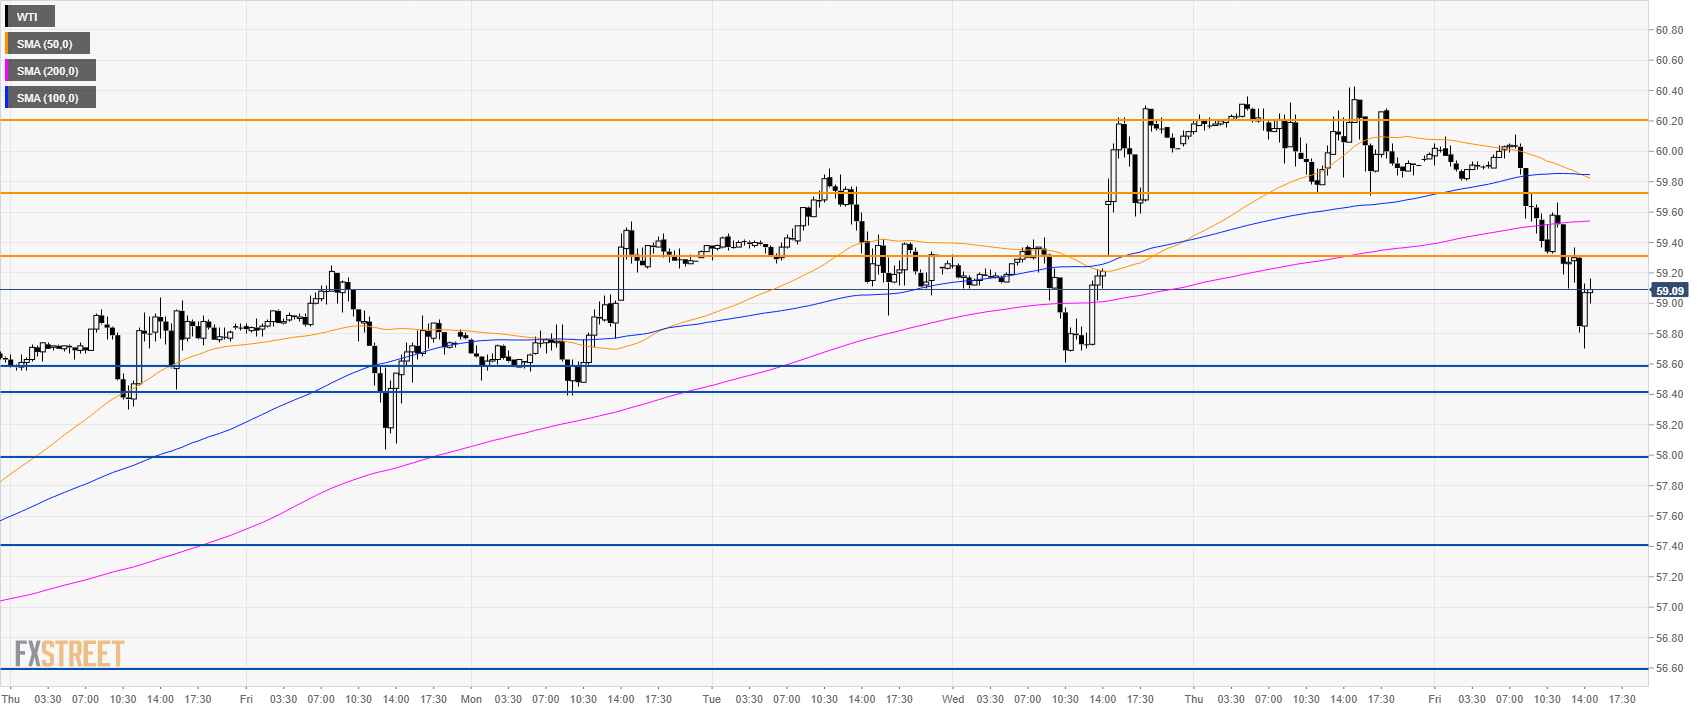

Oil 30-minute chart

  • Oil is trading below its main SMAs suggesting bearish momentum in the near-term.
  • Support is at 58.60, 58.40 and 58.00 level.  
  • To the upside, bulls will be looking at the 59.30, 59.75 and 60.20 resistances.  


Additional key levels


FX Street

FX Street

FXStreet is the leading independent portal dedicated to the Foreign Exchange (Forex) market. It was launched in 2000 and the portal has always been proud of their unyielding commitment to provide objective and unbiased information, to enable their users to take better and more confident decisions.