- After several days of range, WTI eventually dropped to 11-day lows.
- The level to beat for bears is the 55.50 support.
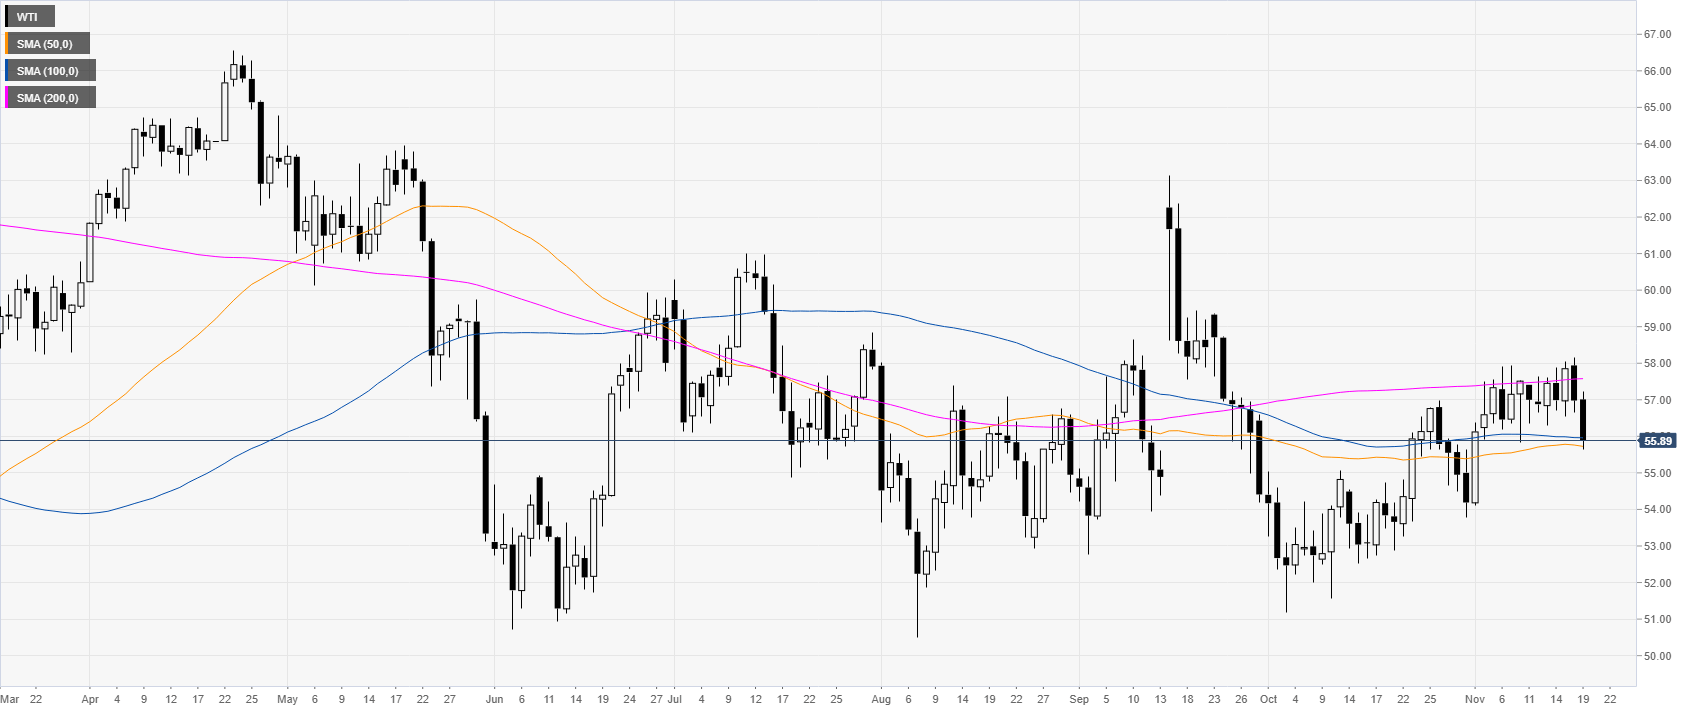
Crude oil daily chart
The crude oil West Texas Intermediate (WTI) is currently trading just below $56.00 a barrel and the 100/200-day simple moving averages (DMAs).
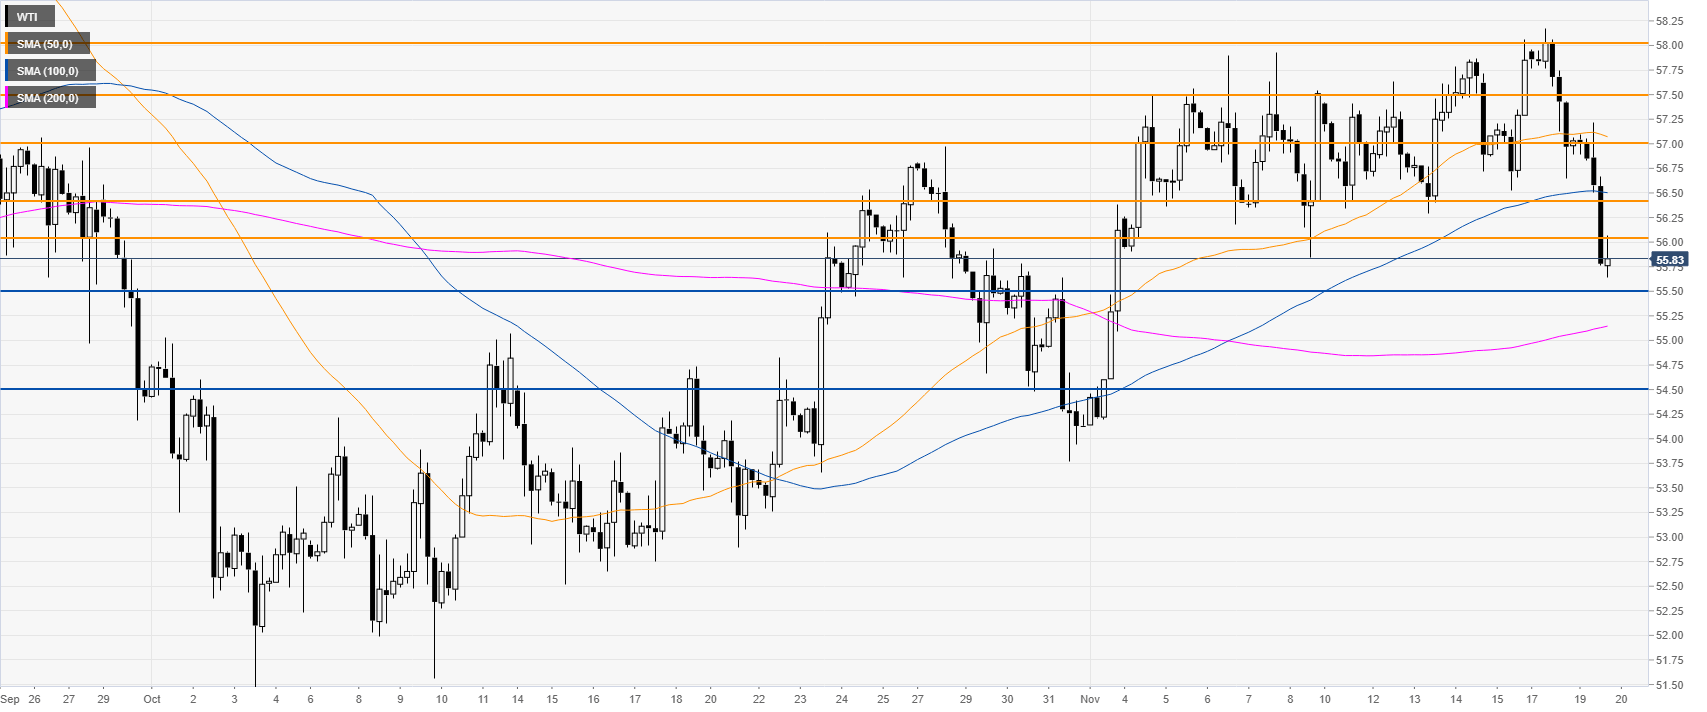
Crude oil four-hour chart
WTI is sliding below the 56.00 handle and the 50 and 100 SMAs, driving prices to 11-day lows. The level to beat for sellers become the 55.50 level, which was important in October. A successful break below this level can lead to 54.50 in the medium term.
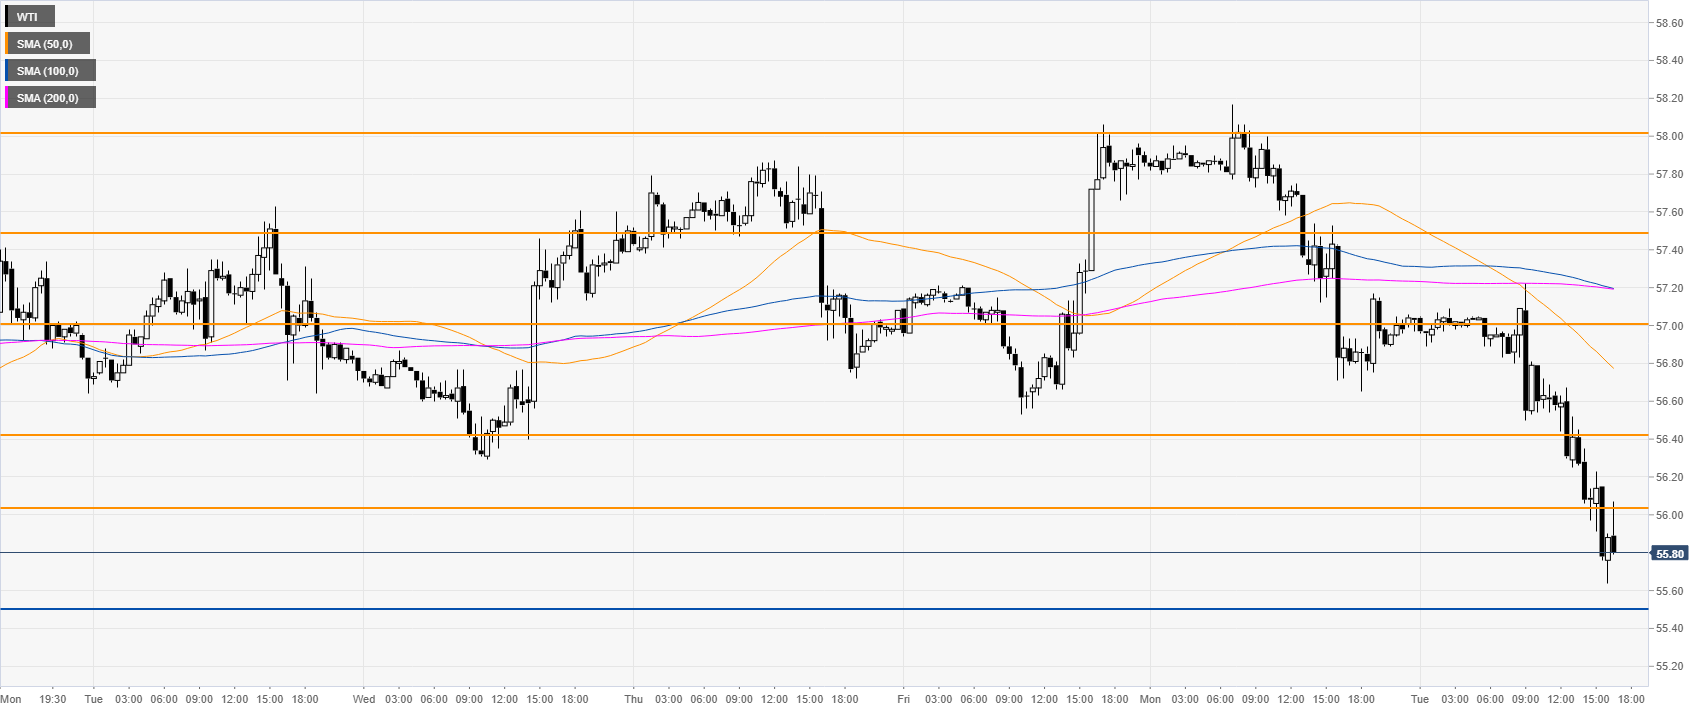
Crude oil 30-minute chart
The is trading below its main SMAs, suggesting a bearish bias in the near term. Resistances are seen at the 56.04, 56.40 and 57.00 handle.
Additional key levels
