- WTI erases daily gains after EIA-inspired spike.
- The level to beat for bears is $55.40 a barrel.
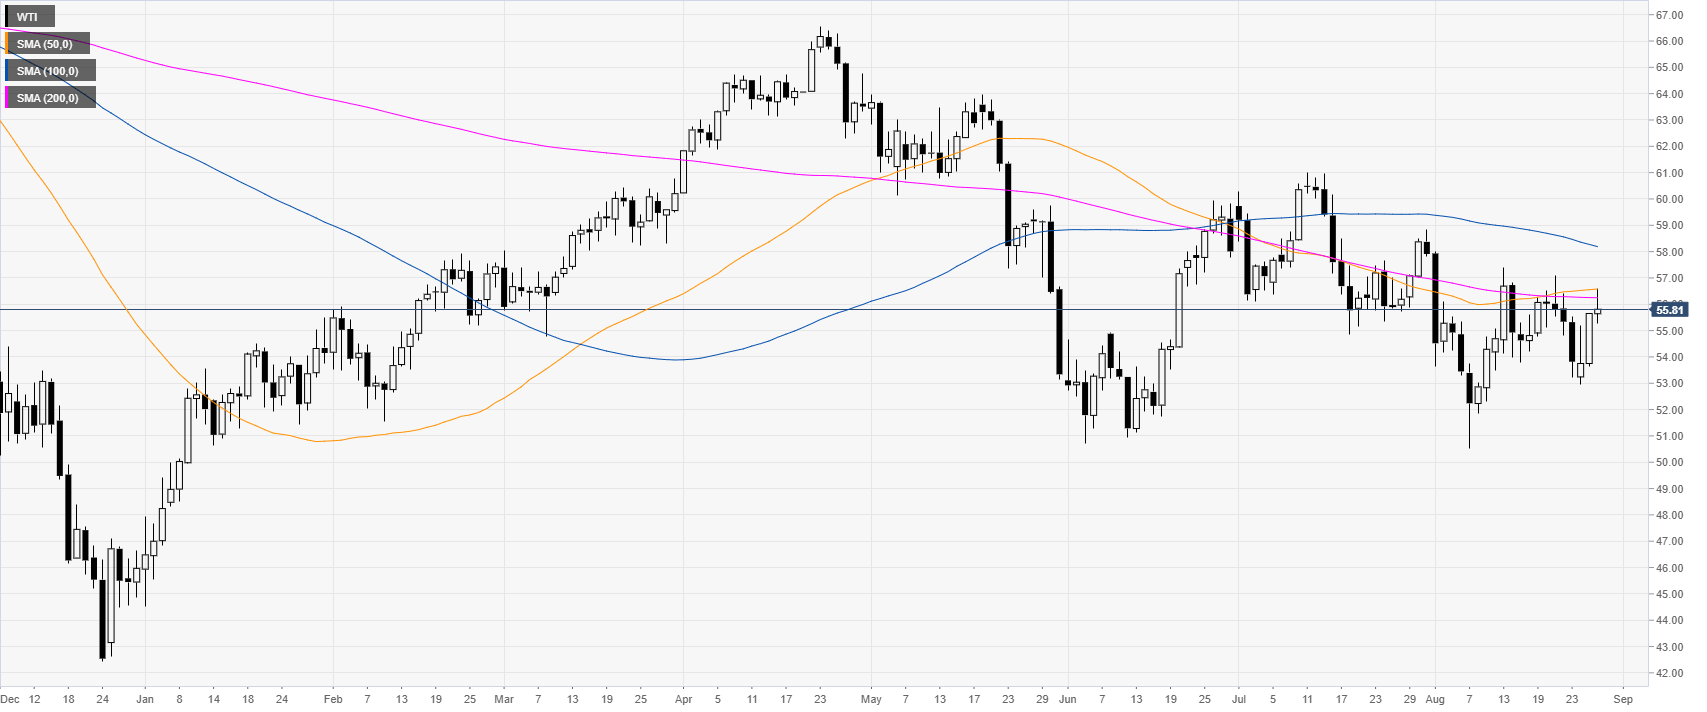
Oil daily chart
WTI (West Texas Intermediate) traded as high as $56.59 a barrel near the 50/200-daily simple moving averages (SMAs) but the market found no acceptance above that level. Oil is trading below its main SMAs, suggesting an overall bearish bias.
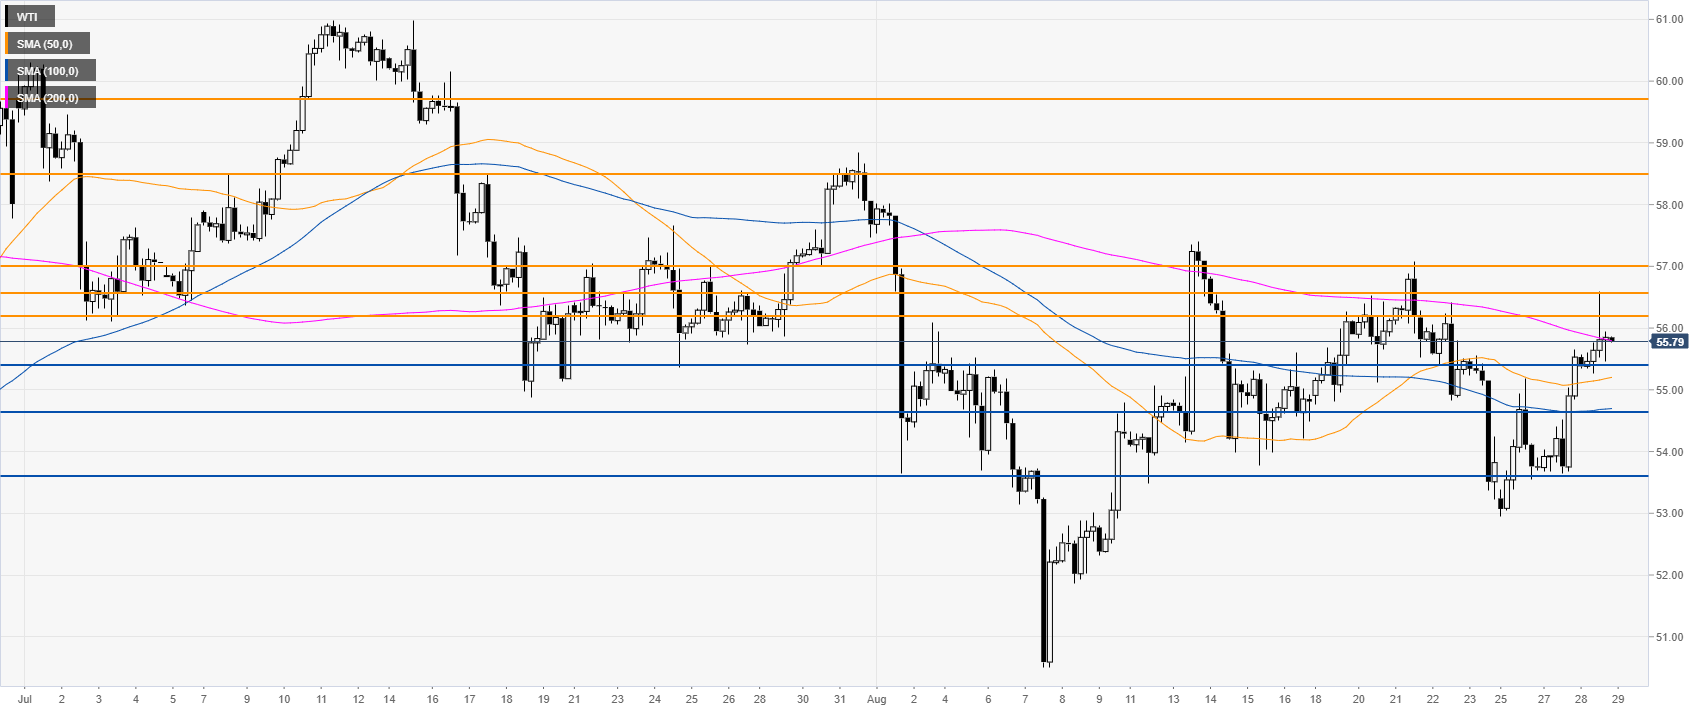
Oil 4-hour chart
WTI is trading below 65.20 resistance and the 200 SMA suggesting bearish momentum in the medium term. Bears would need to initially break below the 55.40 level to reach 54.65 and 53.60 on the way down.
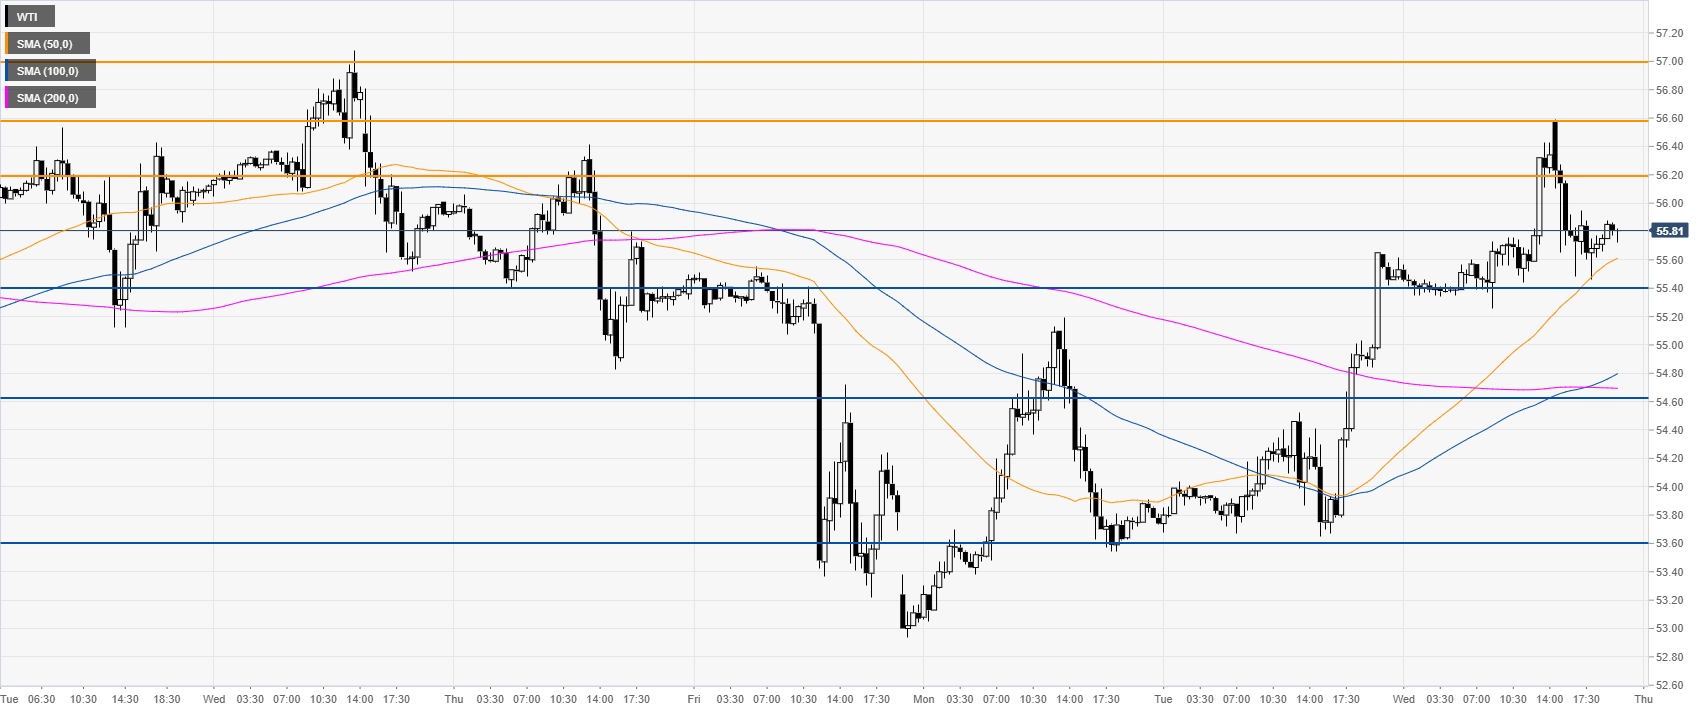
Oil 30-minute chart
Oil is trading above its main SMAs, suggesting bullish momentum in the near term. Black gold could find immediate resistance at the 56.20, 56.50 and 57.00 levels. In the New York session, the EIA reported a draw of -10.027M vs. -2.112M expected. The market initially spiked up on the bullish news but then the sellers stepped in and drove the market below the 56.00 figure.
Additional key levels


