- Oil is sharply down for the second consecutive day.
- The level to beat for bears are seen at 56.40 and 56.00
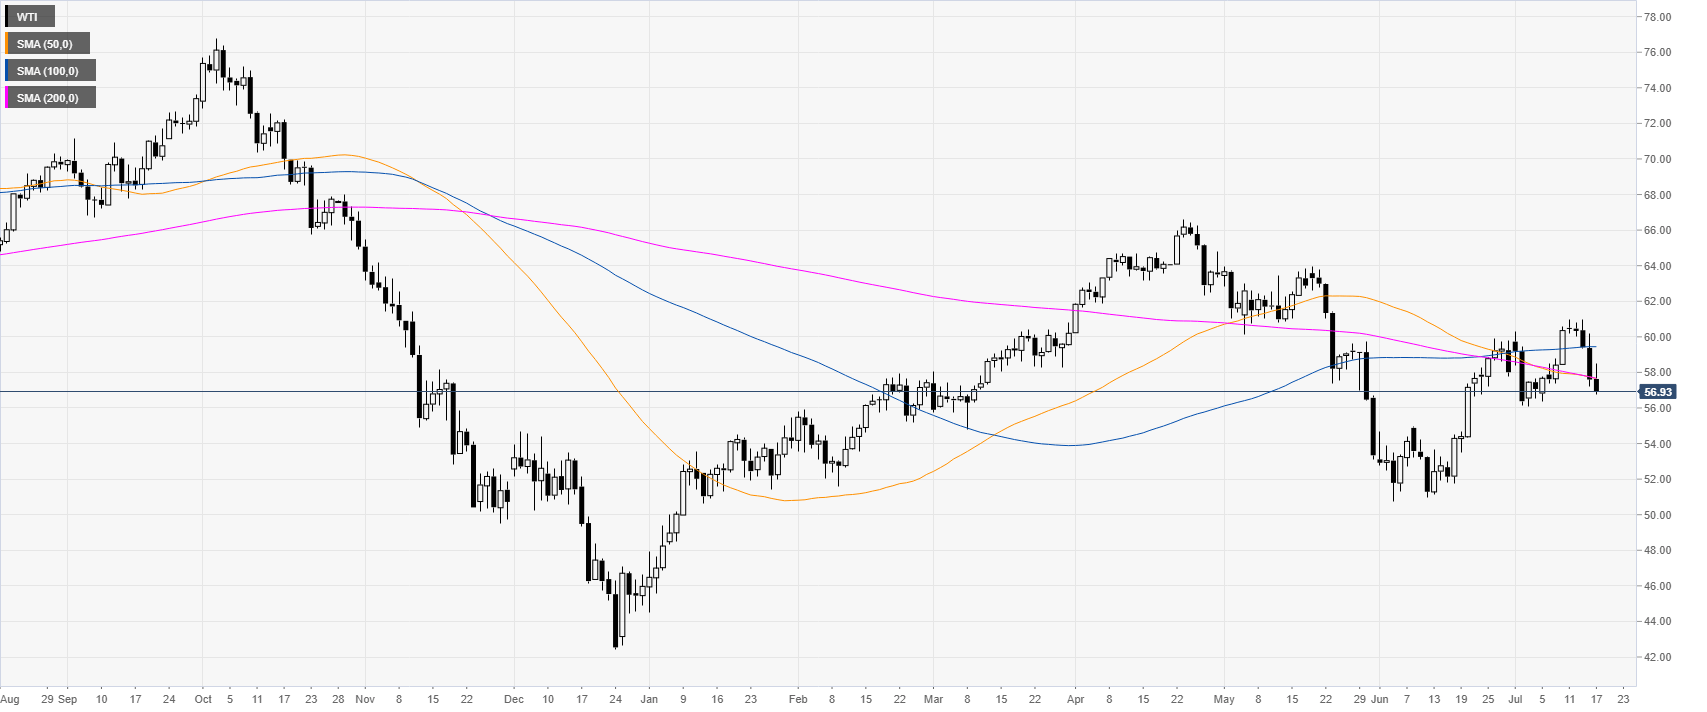
Oil daily chart
WTI (West Texas Intermediate) is declining sharply below $58.00 a barrel and its main daily simple moving averages (DSMAs).

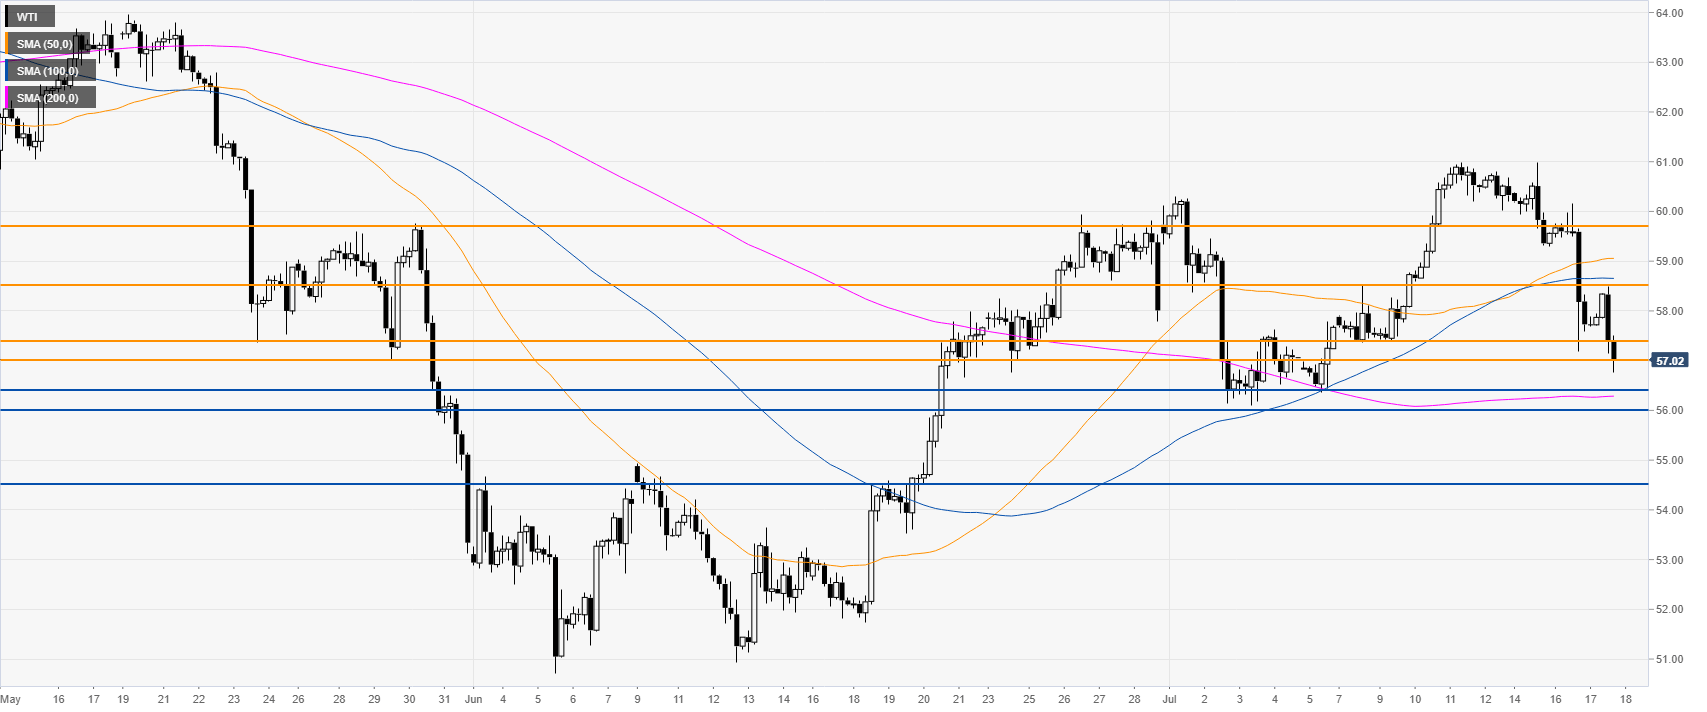
Oil 4-hour chart
The market is trading below 57.00 and the 50 and 100 SMAs. Bears likley intend to drive the market towards the 56.40 and 56.00 supports.
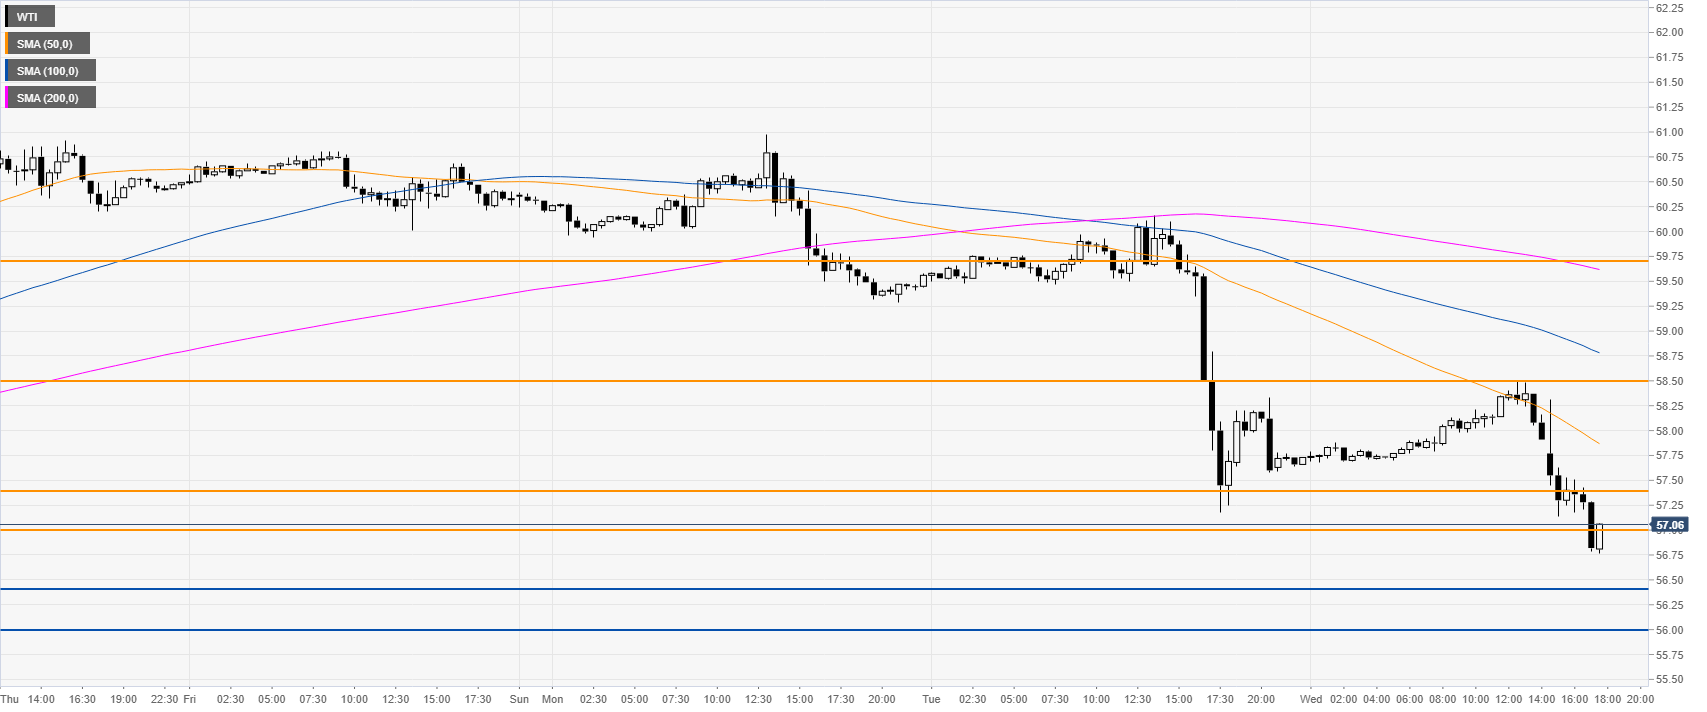
Oil 30-minute chart
Oil is trading below its main SMAs suggesting bearish momentum in the near term. Immediate resistancess are seen at 57.00, 57.40 and 58.50.
Additional key levels