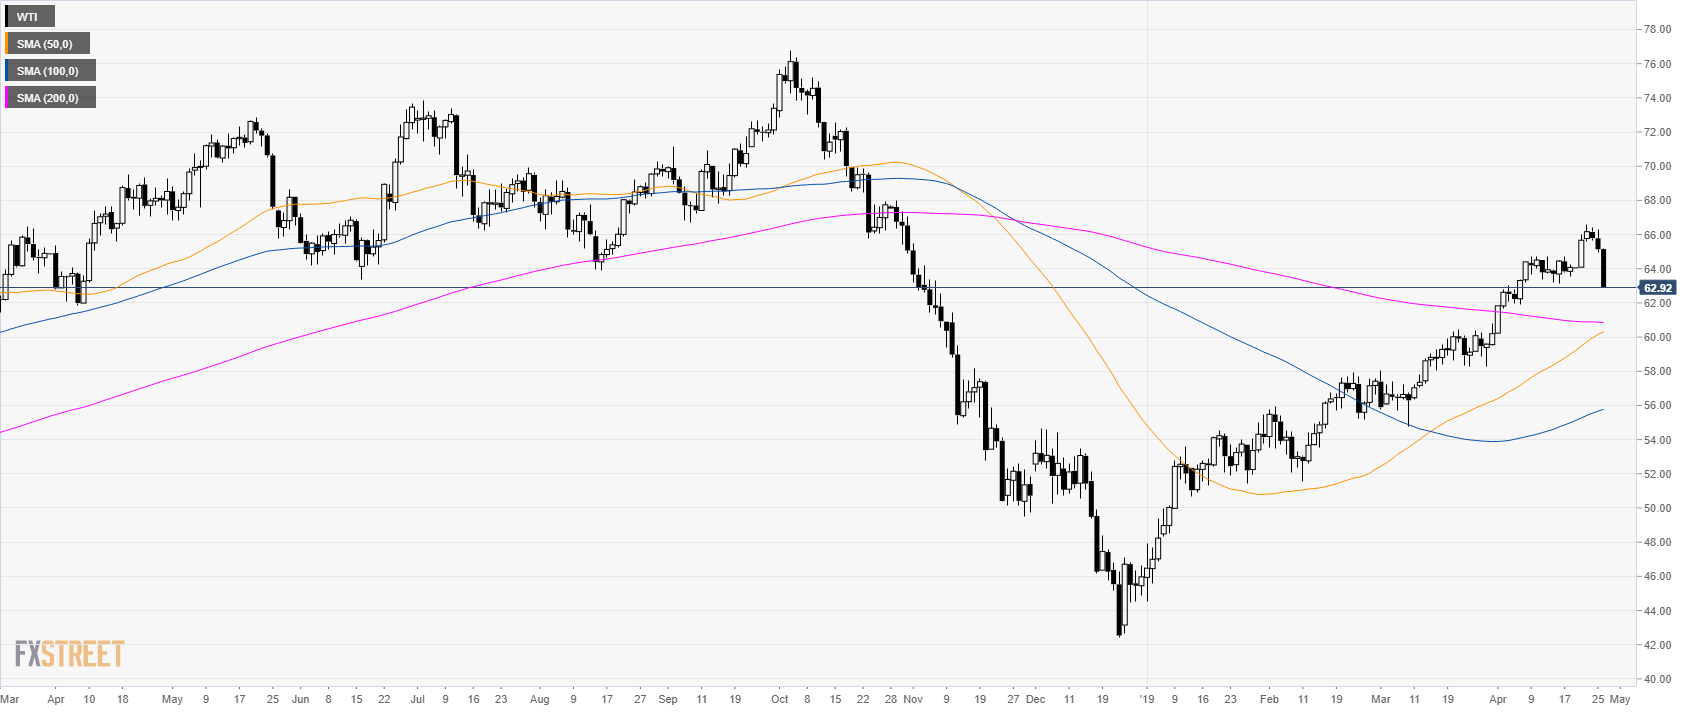
Home Oil Technical Analysis: WTI slumps to 2-week low near $63.00 a barrel
FXStreet News

Oil Technical Analysis: WTI slumps to 2-week low near $63.00 a barrel

Oil daily chart

  • WTI is trading in a bull trend above its main simple moving averages (SMAs).
  • WTI is currently having the worst daily decline since December 2018.
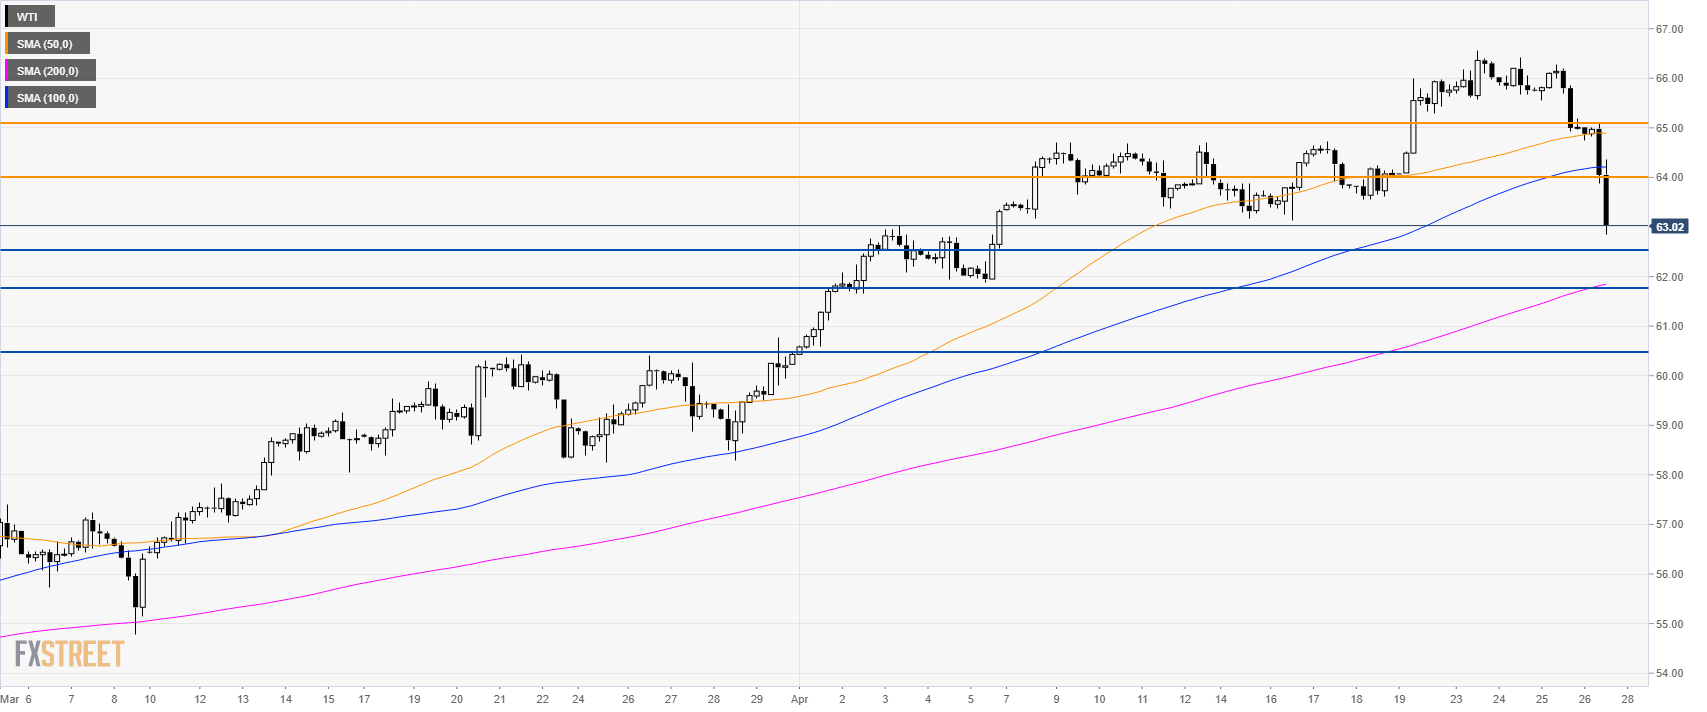
Oil 4-hour chart

  • The market is trading below its 50 and 100 SMAs suggesting a correction down.
  • The market is likely going to continue to decline towards 62.50 level. The next supports in line are seen at 61.80 and 60.50.
  • Resistances are seen at 64.00 and 65.00 level.

Additional key levels


FX Street

FX Street

FXStreet is the leading independent portal dedicated to the Foreign Exchange (Forex) market. It was launched in 2000 and the portal has always been proud of their unyielding commitment to provide objective and unbiased information, to enable their users to take better and more confident decisions.