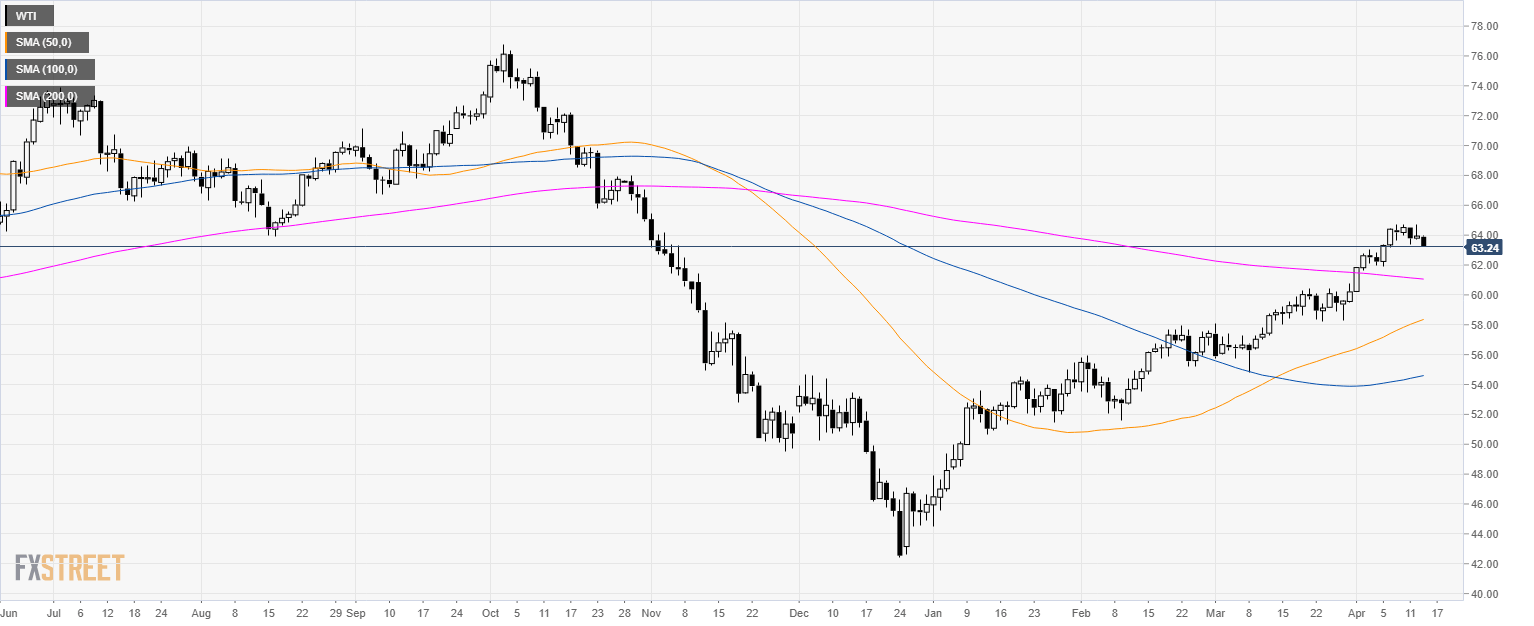
Home Oil Technical Analysis: WTI starts the week with a slump towards $63.00 a barrel
FXStreet News

Oil Technical Analysis: WTI starts the week with a slump towards $63.00 a barrel

Oil daily chart

  • WTI is trading in a bull trend above its main simple moving averages (SMAs).
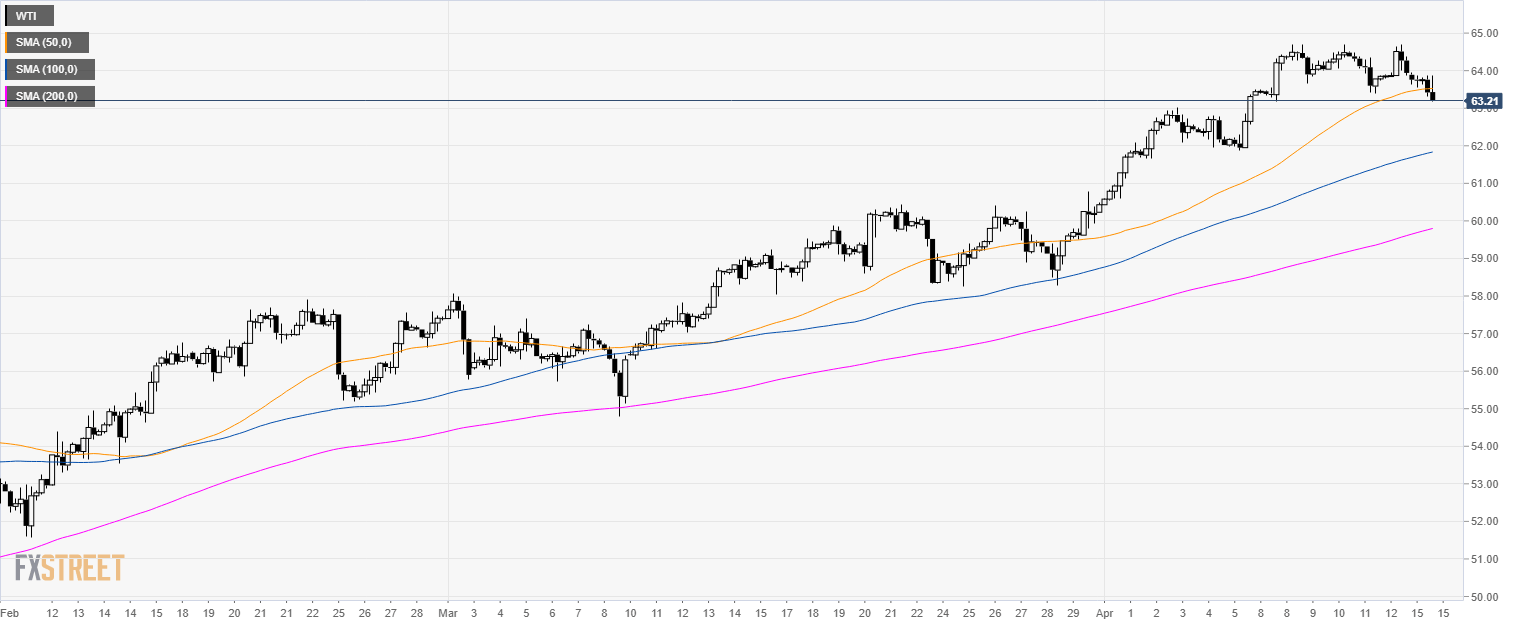
Oil 4-hour chart

  • Crude oil WTI is trading below its main 50 SMA suggesting a correction in the medium-term.
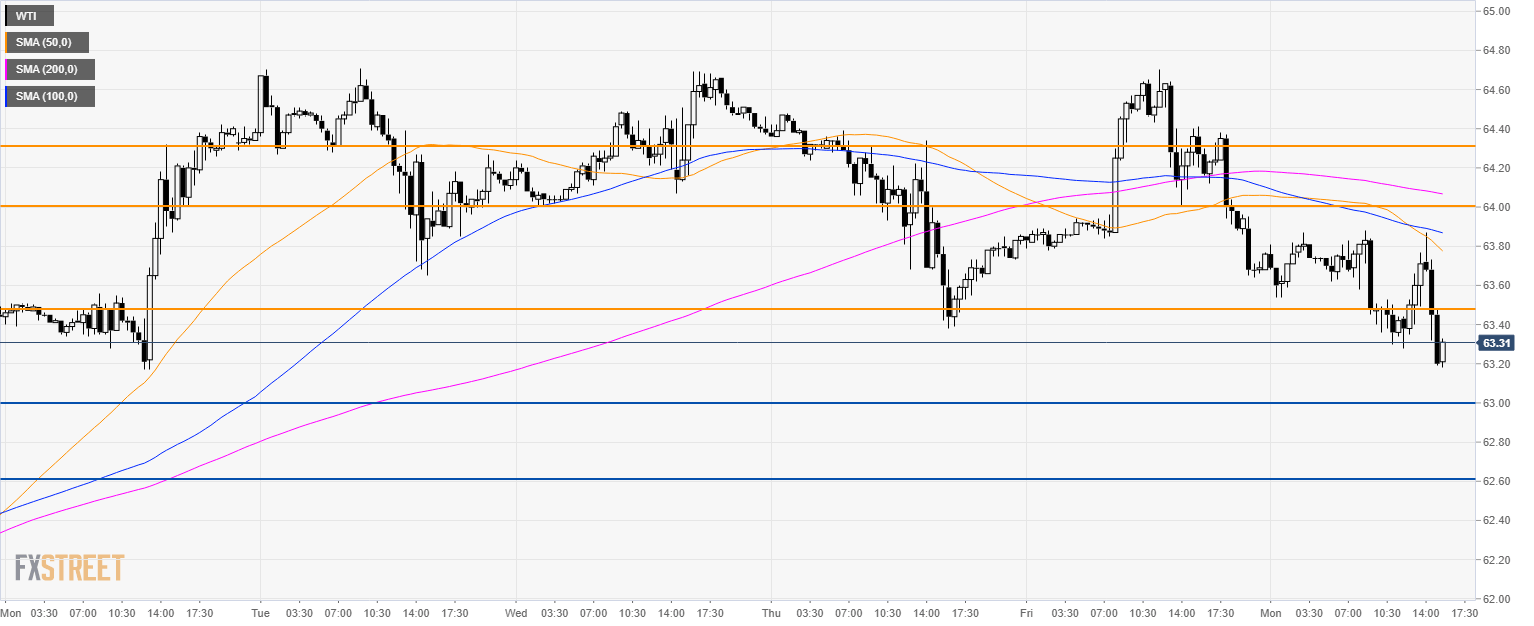
Oil 30-minute chart

  • WTI is trading below its main SMAs suggesting a bearish bias in the short-term.
  • The market can decline towards 63.00 and 62.60 level.  
  • Resistance is seen at 63.50 and 64.00 figure.  

Additional key levels


FX Street

FX Street

FXStreet is the leading independent portal dedicated to the Foreign Exchange (Forex) market. It was launched in 2000 and the portal has always been proud of their unyielding commitment to provide objective and unbiased information, to enable their users to take better and more confident decisions.